


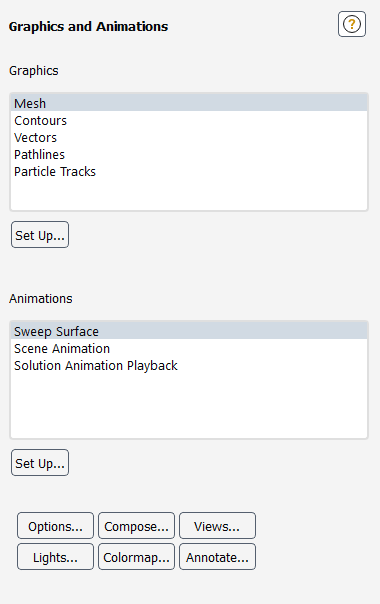
The Graphics and Animation task page allows you to visualize the results of your CFD simulation by allowing you to set up plots of contours, vectors, pathlines, particle tracks, scene descriptions and animations. See Displaying Graphics for more information.
Controls
- Graphics
displays a list of the available graphics objects.
You can double-click an item in the Graphics list to open the corresponding dialog box, or you can select the item in the list and click the Set Up... button.
- Mesh
- selecting this item and clicking the Set Up... button opens the Mesh Display Dialog Box.
- Contours
- selecting this item and clicking the Set Up... button opens the Contours Dialog Box.
- Vectors
- selecting this item and clicking the Set Up... button opens the Vectors Dialog Box.
- Pathlines
- selecting this item and clicking the Set Up... button opens the Pathlines Dialog Box.
- Particle Tracks
- selecting this item and clicking the Set Up... button opens the Particle Tracks Dialog Box.
- Set Up...
opens the dialog box corresponding to the selected object in the Graphics list.
- Animations
displays a list of the available animation objects.
You can double-click an item in the Animations list to open the corresponding dialog box, or you can select the item in the list and click the Set Up... button.
- Sweep Surface
- selecting this item and clicking the Set Up... button opens the Sweep Surface Dialog Box.
- Scene Animation
- selecting this item and clicking the Set Up... button opens the Animate Dialog Box.
- Solution Animation
- selecting this item and clicking the Set Up... button opens the Playback Dialog Box.
- Set Up...
opens the dialog box corresponding to the selected object in the Animations list.
- Options...
opens the Display Options Dialog Box.
- Scene...
opens the Scene Description Dialog Box.
- Views...
opens the Views Dialog Box.
- Lights...
opens the Lights Dialog Box.
- Colormap...
opens the Colormap Dialog Box.
- Annotate...
opens the Annotate Dialog Box.
For additional information, see the following sections:
- 51.18.1. Profile Options Dialog Box
- 51.18.2. Vector Options Dialog Box
- 51.18.3. Custom Vectors Dialog Box
- 51.18.4. Vector Definitions Dialog Box
- 51.18.5. Path Style Attributes Dialog Box
- 51.18.6. Ribbon Attributes Dialog Box
- 51.18.7. Particle Filter Attributes Dialog Box
- 51.18.8. Reporting Variables Dialog Box
- 51.18.9. Track Style Attributes Dialog Box
- 51.18.10. Particle Sphere Style Attributes Dialog Box
- 51.18.11. Particle Vector Style Attributes Dialog Box
- 51.18.12. Sweep Surface Dialog Box
- 51.18.13. Create Surface Dialog Box
- 51.18.14. Animate Dialog Box
- 51.18.15. Save Picture Dialog Box
- 51.18.16. Playback Dialog Box
- 51.18.17. Video Options Dialog Box
- 51.18.18. Advanced Video Quality Options Dialog Box
- 51.18.19. Display Options Dialog Box
- 51.18.20. Scene Description Dialog Box
- 51.18.21. Display Properties Dialog Box
- 51.18.22. Transformations Dialog Box
- 51.18.23. Iso-Value Dialog Box
- 51.18.24. Pathline Attributes Dialog Box
- 51.18.25. Bounding Frame Dialog Box
- 51.18.26. Views Dialog Box
- 51.18.27. Write Views Dialog Box
- 51.18.28. Mirror Planes Dialog Box
- 51.18.29. Periodic Instancing Dialog Box
- 51.18.30. Camera Parameters Dialog Box
- 51.18.31. Lights Dialog Box
- 51.18.32. Colormap Dialog Box
- 51.18.33. Colormap Editor Dialog Box
- 51.18.34. Annotate Dialog Box
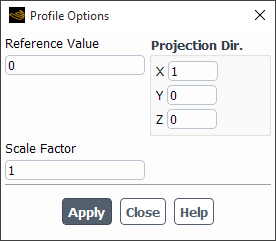
The Profile Options dialog box controls the scaling and projection direction of profiles. It is opened from the Contours Dialog Box, and you will display the profiles using the Display button in that dialog box. See Displaying Contours and Profiles for details about the items below.
Controls
- Reference Value
sets the "zero height" reference value for the profile. Any point on the profile with a value equal to the Reference Value will be plotted exactly on the defining surface. Values greater than the Reference Value will be projected ahead of the surface (in the direction of Projection Dir. and scaled by Scale Factor), and values less than the Reference Value will be projected behind the surface.
- Scale Factor
sets the length scale factor for projection. After subtracting off the Reference Value, Ansys Fluent multiplies the resulting solution value by the Scale Factor to form a length.
- Projection Dir.
sets the direction in which profiles are projected. In 2D, for example, a contour plot of pressure on the entire domain can be projected in the
 direction to form a carpet plot, or a contour plot
of
direction to form a carpet plot, or a contour plot
of  velocity on a sequence of
  -coordinate slice lines can be
projected in the
-coordinate slice lines can be
projected in the  direction to form a series of velocity profiles.
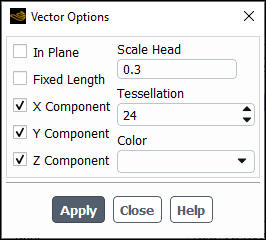
The Vector Options dialog box allows you to set additional parameters for vector displays. It is opened from the Vectors Dialog Box. See Vector Plot Options for details about the items below.
Controls
- In Plane
toggles the display of vector components in the plane of the surface selected for display. This feature is useful for visualizing components that are normal to the flow. See Drawing Vectors in the Plane of the Surface for details.
- Fixed Length
enables the display of vectors that are all the same length. See Displaying Fixed-Length Vectors for details.
- X, Y, Z Component
toggle the display of the Cartesian components of the vectors. See Displaying Vector Components for details.
- Scale Head
controls the size of the arrowhead on vector styles that include heads.
- Tessellation
controls the tessellation of the 3d arrow and 3d arrowhead vector styles. The smaller the tessellation value, the better the performance of the vector plot display. Valid inputs are in the range of
0-74.- Color
specifies a single color for the display of all vectors. See Displaying Vectors Using a Single Color for details.
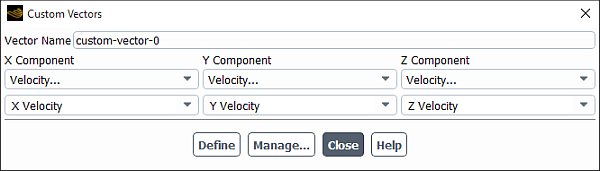
The Custom Vectors dialog box allows you to define custom vectors based on existing quantities. Any vectors that you define will be added to the Vectors of list in the Vectors Dialog Box. To open the Custom Vectors dialog box, click Custom Vectors... in the Vectors dialog box. See Creating and Managing Custom Vectors for details about custom vectors.
Controls
- Vector Name
specifies the name of the vector you are defining. Should you decide to change the name after you have defined the vector, you can do so in the Vector Definitions Dialog Box, which you can open by clicking on the Manage... button.
- X, Y, Z Component
specify the
 ,
,  , and
, and  components of the vector. Each drop-down list contains
the available field functions.
components of the vector. Each drop-down list contains
the available field functions.- Define
creates the vector and adds it to the Vectors of list in the Vectors Dialog Box.
- Manage...
opens the Vector Definitions Dialog Box, which enables you to check, rename, save, load, and delete custom vectors.
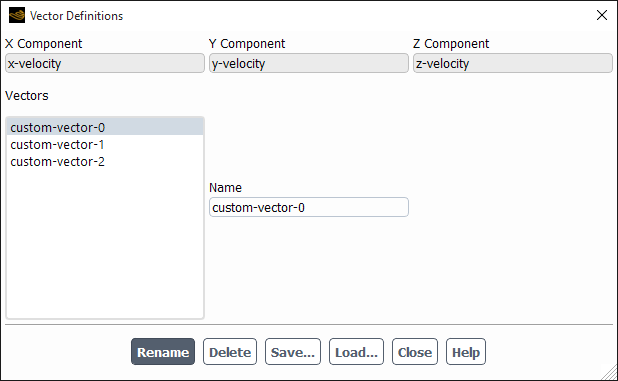
The Vector Definitions dialog box allows you to check, rename, save, load, and delete custom vectors that you defined in the Custom Vectors Dialog Box. See Creating and Managing Custom Vectors for details about the items below.
Controls
- X, Y, Z Component
display the
 ,
,  , and
, and  components of the vector.
- Vectors
contains a selectable list of custom vectors. When you select a vector, its components will appear in the X, Y, and Z Component fields, and its name will appear in the Name field.
- Name
displays the name of the currently selected vector. You can enter a new name in this box if you want to rename the vector.
- Rename
changes the name of the selected function to the name specified in the Name field.
- Delete
deletes the selected vector.
- Save...
opens The Select File Dialog Box, in which you can specify a file in which to save all of the custom vectors in the Vectors list.
- Load...
opens the Select File dialog box, in which you can specify a file from which to read custom vectors (a file that you saved using the Save... button above).
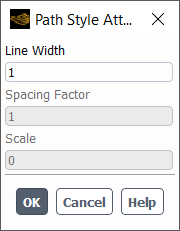
To modify the line width, cylinder radius or marker size, use the Path Style Attributes dialog box. You can open this dialog box by clicking the Attributes... button in the Pathlines Dialog Box. See Controlling the Pathline Style for details about the items below.
Controls
- Line Width/Marker Size/Width
determines the thickness of the pathlines.
- Diameter
specifies the diameter of the sphere. This parameter appears only when sphere is selected under Style in the Pathlines dialog box.
- Spacing Factor
controls the spacing of arrows when you use the line-arrows style.
- Scale
controls the size of the arrow heads when you use the line-arrows style.
- Detail
specifies the detail applied to the graphical rendering of the spheres. This parameter appears only when sphere is selected under Style in the Pathlines dialog box.
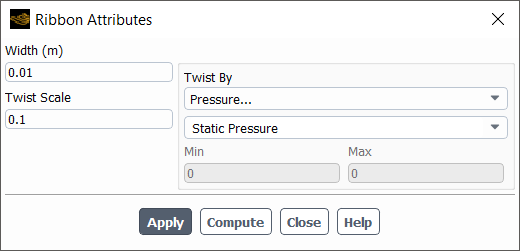
To modify the ribbon width and set the scalar field by which to twist the ribbon, use the Ribbon Attributes dialog box. You can open this dialog box by clicking the Attributes... button in the Pathlines Dialog Box when the selected Style is ribbon. See Controlling the Pathline Style for details about the items below.
Controls
- Width
determines the thickness of the ribbon.
- Twist Scale
sets the amount of twist for a given field. To magnify the twist for a field with very little change, increase this factor; to display less twist for a field with dramatic changes, decrease this factor.
- Twist By
contains a drop-down list from which you can select a scalar field on which pathline twisting is based.
- Min/Max
displays the minimum/maximum value of the scalar field selected in Twist By.
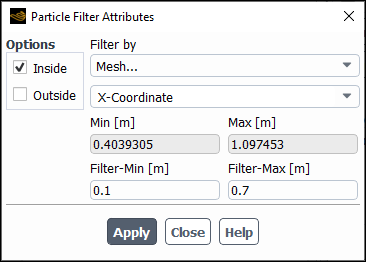
The Particle Filter Attributes dialog box allows you to specify how you would like to filter the particles being displayed. This dialog box opens when you click Filter by... in Particle Tracks Dialog Box. See Particle Filtering for details about the items below.
Controls
- Options
contains the filtering options.
- Inside
enables the filtering of particles with values between Filter-Min and Filter-Max.
- Outside
enables the filtering of particles with values less than Filter-Min or greater than Filter-Max.
- Filter by
contains a list from which you can select any field variable, except for Custom Field Functions..., to be used as a filter variable.
- Min/Max
displays the minimum and maximum values of the selected field variable. The real number field values are not editable; they are purely informational.
- Filter-Min/Filter-Max
defines the minimum/maximum filter threshold.
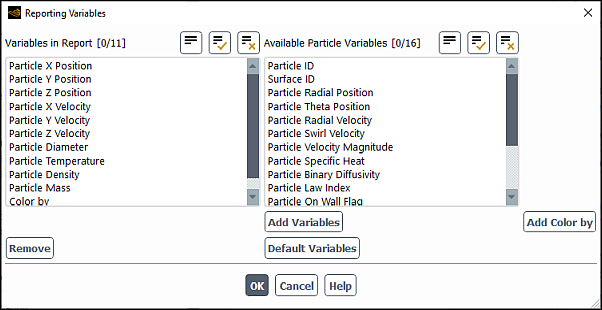
The Reporting Variables dialog box allows you to control the particle variables that you include in your reporting. See Step-by-Step Reporting of Trajectories for details about the items below.
Controls
- Variables in Report
contains all variables currently in the report.
- Remove
removes the selected variable from the report.
- Default Variables
restores the default list.
- Available Particle Variables
contains the particle variables that are available for you to select.
- Add Variables
takes the selected variable from the Available Particle Variables list and adds it to the Variables in Report list.
- Add Color By
adds the Color by variable to the Variables in Report list.
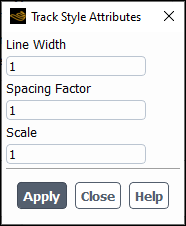
To modify the line width, cylinder radius or marker size, use the Track Style Attributes dialog box. You can open this dialog box by clicking the Attributes... button in the Particle Tracks Dialog Box. See Controlling the Particle Tracking Style for details about the items below.
Controls
- Line Width/Marker Size/Width
determines the thickness of the particle tracks.
- Spacing Factor
controls the spacing of arrows when you use the line-arrows style.
- Scale
controls the size of the arrow heads when you use the line-arrows style.
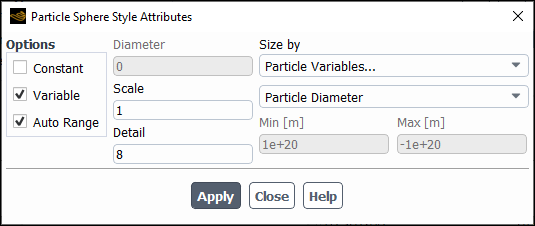
To modify the attributes of the particle sphere, use the Particle Sphere Style Attributes dialog box. Select sphere from the Track Style drop-down list and click the Attributes... button in the Particle Tracks Dialog Box to open the Particle Sphere Style Attributes dialog box. See Controlling the Particle Tracking Style for details about the items below.
Controls
- Options
allows you to choose how you would like to specify the particle diameter.
- Constant
allows you to specify the diameter as a constant value.
- Variable
allows you to select a particle variable to estimate the size of the spheres.
- Auto Range
when disabled clips the displayed particles to the values given in Min and Max.
- Diameter
specifies the diameter of the sphere.
- Scale
allows you to scale the spheres by the factor entered in this field.
- Detail
specifies the detail applied to the graphical rendering of the spheres.
- Size by
contains a list of variables by which you can estimate the size of your particle. This list is selectable only when you are using the Variable option.
- Min/Max
defines the minimum and maximum values of the selected field variable to display.
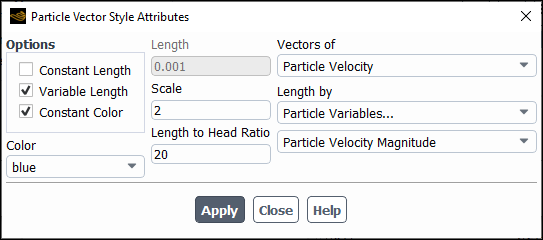
To modify the attributes of the vector styles, use the Particle Vector Style Attributes dialog box. See Controlling the Vector Style of Particle Tracks for details about the items below.
Controls
- Options
allows you to choose how you would like to specify the particle diameter.
- Constant Length
allows you to specify the vector length as a constant value.
- Variable Length
results in a vector length that is based on the variable selected under Length by.
- Constant Color
when enabled allows you to select a vector color from the Color drop-down list. Otherwise, the vector is colored based on the variable selected in the Particle Tracks dialog box (seen in the Mesh Colors dialog box when Draw Mesh is enabled).
- Length
specifies the length of the vector.
- Scale
allows you to scale the vectors by the factor entered in this field.
- Length to Head Ratio
is the ratio of vector length to vector head size.
- Vectors of
contains the particle vector variable to display.
- Length by
is used to estimate the length of the vector when the Variable Length option is enabled.
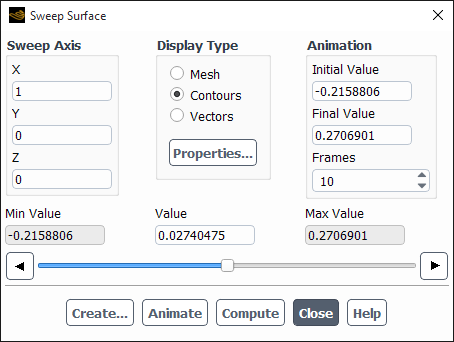
The Sweep Surface dialog box controls the display and animation of mesh, contour, and vector plots generated on a sweep surface. See Displaying Results on a Sweep Surface for details about the items below.
Controls
- Sweep Axis
specifies the (X, Y, Z) vector representing the axis along which the surface should be swept.
- Display Type
specifies the type of display to be swept through the domain (Mesh, Contours, or Vectors).
- Properties...
opens the Contours Dialog Box if Contours is the selected Display Type, or the Vectors Dialog Box if Vectors is the selected Display Type. (This button is not available if Mesh is the selected Display Type.)
- Animation
contains controls for animating the sweep-surface display.
- Initial Value, Final Value
specify the initial and final positions for the animation.
- Frames
specifies the number of frames in the animation.
- Min Value, Max Value
show the minimum and maximum extents of the domain along the specified Sweep Axis. These values are updated when you click Compute.
- Value
shows the current position at which the requested display is plotted. You can change the value by moving the slide bar below it, or by entering a new value and pressing the
<RETURN>key.- Create...
opens the Create Surface Dialog Box, where you can create a surface from the currently-displayed sweep surface.
- Animate
animates the display, sweeping the requested display through the domain along the specified axis.
- Compute
updates the Min Value and Max Value to reflect the minimum and maximum extents of the domain along the specified Sweep Axis.
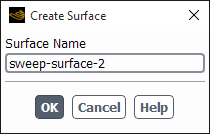
The Create Surface dialog box allows you to save a sweep surface for later use. You can open it by clicking Create... in the Sweep Surface Dialog Box. See Displaying Results on a Sweep Surface for details about the items below.
Controls
- Surface Name
specifies a name for the surface to be created.
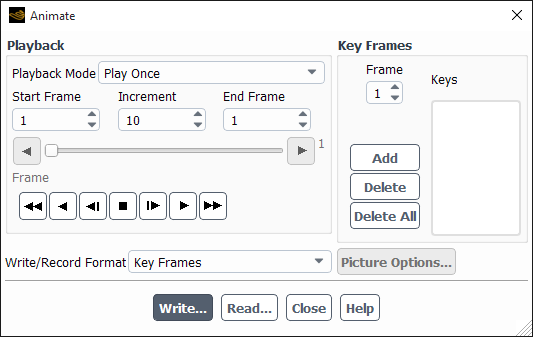
The Animate dialog box allows you to specify key frames that define the basic movement of an animated sequence, and then play back the animation. Ansys Fluent interpolates between your specified key frames. See Animating Graphics for details about the items below.
Controls
- Playback
contains the controls that you use to play back the animation. See Playing an Animation for details.
- Playback Mode
contains a drop-down list of playback options.
- Play Once
sets the option to play back frames from Start Frame to End Frame once.
- Auto Repeat
sets the option to continually play back frames from Start Frame to End Frame.
- Auto Reverse
sets the option to continually play back the images while reversing playback direction after each set.
- Start Frame, End Frame
set the frames at which the animation should begin and end. By changing these numbers you can view a subset of the frames.
- Increment
sets the number of frames to increment the frame-counter by when you use the fast-forward or fast-reverse buttons.
- Frame
shows the number of the frame that is currently displayed, as well as its relative position in the entire animation. If you slide the bar to a different location, the frame corresponding to the new frame number will be displayed in the graphics window.
- (Tape Player Buttons)
allow you to play the animation forward and backward, fast-reverse and fast-forward the animation, and stop it. The buttons function in a way similar to those on a standard video cassette player.
- Key Frames
contains the controls that you use to define the key frames for the animation. See Creating an Animation for details.
- Frame
sets the number to be assigned to the next key frame added to the list of Keys.
- Keys
contains a list of the key frames that have been defined. If you select a key frame in this list, the associated scene will be displayed in the graphics window.
- Add
creates a key frame with the number shown in Frame for the scene currently displayed in the graphics window.
Important: Be sure to change the frame number before you add the new key frame so that you will not overwrite the last key frame that you created.
- Delete
deletes the key frame that is selected in the Keys list.
- Delete All
deletes all key frames in the Keys list.
- Write/Record Format
specifies Key Frames, Picture Files, MPEG, or Video (not available on Windows) as the format in which to save the animation. See Saving an Animation for details about these options.
- Picture Options...
opens the Save Picture Dialog Box, in which you can specify parameters for saving the animation to picture files. This button is available only when Picture Files is selected as the Write/Record Format.
- Write...
opens The Select File Dialog Box, in which you can specify a name for the animation file and save it.
- Read...
opens the Select File dialog box, in which you can specify the name of the animation file to be read. Note that the current case and data should contain the surfaces and any other information that the key frame description refers to. See Reading an Animation File.
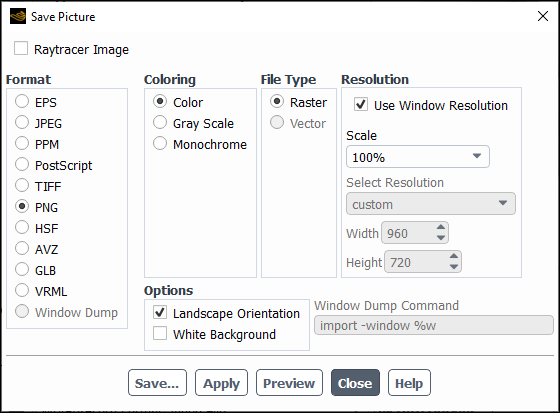
The Save Picture dialog box allows you to set save picture parameters and save picture files of graphics windows. See Saving Picture Files for details on the use of this dialog box.
Controls
- Raytracer Image
Saves the current image using a raytracing renderer for enhanced image quality. Refer to Realistic Rendering Using Raytracing for additional information on raytracing.
- Format
allows you to select the format of picture files.
- EPS
(Encapsulated PostScript) output is the same as PostScript output, with the addition of Adobe Document Structuring Conventions (v2) statements. Currently, no preview bitmap is included in EPS output. Often, programs that import EPS files use the preview bitmap to display on-screen, although the actual vector PostScript information is used for printing (on a PostScript device). You can save EPS files in raster or vector format.
- JPEG
is a common raster file format.
- PPM
output is a common raster file format.
- PostScript
is a common vector file format. You can also choose to save a PostScript file in raster format.
- TIFF
is a common raster file format.
- PNG
is a common raster file format.
- HSF
is HOOPS Visualize Stream Format, a highly-compressible and streamable 2D/3D file format.
- AVZ
is the free Ansys Viewer Format, which is a 3D file format allowing you to visualize, share, collaborate, and interactively manipulate the displayed object. For additional information on the Ansys Viewer, refer to Ansys Viewer User's Guide.
- GLB
is a 3D file format frequently used in virtual reality (VR) and augmented reality (AR) applications. The file size is relatively small as it is a binary format of glTF.
- VRML
is a graphics interchange format that allows export of 3D geometrical entities that you can display in the Ansys Fluent graphics window. This format can commonly be used by VR systems and in particular the 3D geometry can be viewed and manipulated in a web-browser graphics window.
Important: Non-geometric entities such as text, titles, color bars, and orientation axis are not exported. In addition, most display or visibility characteristics set in Ansys Fluent, such as lighting, shading method, transparency, face and edge visibility, and outer face culling, are not explicitly exported but are controlled by the software used to view the VRML file.
- Window Dump
(Linux systems only) selects a window dump operation for generating the picture. With this format, you will need to specify the appropriate Window Dump Command.
- Coloring
(all formats except Window Dump) specifies the color mode for the picture file.
- Color
specifies a color-scale copy.
- Gray Scale
specifies a gray-scale copy.
- Monochrome
specifies a black-and-white copy.
Important: Most monochrome PostScript devices will render Color images in shades of gray, but to ensure that the color ramp is rendered as a linearly-increasing gray ramp, you should select Gray Scale.
- File Type
specifies the type of picture file to be saved. See Choosing the File Type for details.
- Raster
specifies a raster type picture. The supported raster formats are EPS, JPEG, PPM, PostScript, TIFF, and PNG.
- Vector
specifies a vector type picture. The supported vector formats are EPS, PostScript, and VRML.
- Resolution
specifies the resolution or the size (in pixels) of the picture.
- Use Window Resolution
uses the resolution of the current graphics window when the image is saved.
- DPI
specifies the resolution of EPS and PostScript files in dots per inch (DPI). The default value for DPI is set to
75.- Width
specifies the width of the raster picture image.
- Height
specifies the height of the raster picture image.
The default value for Width and Height is set to zero, so that the default picture is generated at the same resolution as the active graphics window.
- Options
contains additional options for all picture formats except Window Dump.
- Landscape Orientation
specifies the orientation of the picture. If this option is enabled, the picture is made in landscape mode; otherwise, it is made in portrait mode.
- White Background
controls the foreground/background color. If this option is enabled, the picture is saved with a white background and, for 2D plots, the axes and labels are saved in black.
- Window Dump Command
(Linux systems only) specifies the command to be used to save the picture file, when you select the Window Dump format. See Window Dumps (Linux Systems Only) for details.
- Save...
opens The Select File Dialog Box, in which you can specify a name for the picture file to be saved and then save the file. The resulting file will contain a picture of the active graphics window.
- Apply
saves the current settings. Ansys Fluent will use these settings when making subsequent pictures.
- Preview
applies the current settings to the active graphics window so that you can investigate the effects of different options interactively before saving the final picture.
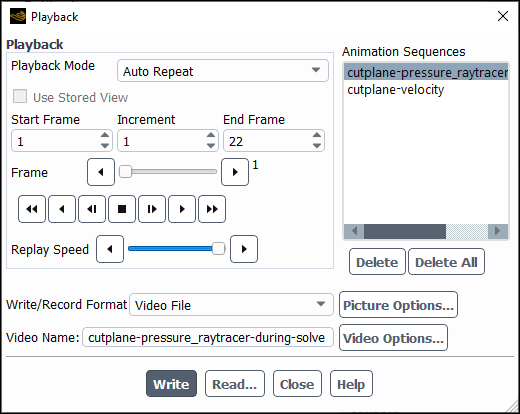
The Playback dialog box allows you to play back an animation sequence. See Playing an Animation Sequence for details about the items below.
Controls
- Playback
contains the controls that you use to play back the selected animation sequence.
- Playback Mode
contains a drop-down list of playback options.
- Play Once
sets the option to play back frames from Start Frame to End Frame once.
- Auto Repeat
sets the option to continually play back frames from Start Frame to End Frame.
- Auto Reverse
sets the option to continually play back the images while reversing playback direction after each set.
- Use Stored View
disabling allows you to modify the view during animation playback (In Memory and HSF File 3D animations only).
- Start Frame, End Frame
set the frames at which the animation should begin and end. By changing these numbers you can view a subset of the frames.
- Increment
sets the number of frames to increment the frame-counter by when you use the fast-forward or fast-reverse buttons.
- Frame
shows the number of the frame that is currently displayed, as well as its relative position in the entire animation. If you slide the bar to a different location, the frame corresponding to the new frame number will be displayed in the graphics window.
- (Tape Player Buttons)
allow you to play the animation forward and backward, fast-reverse and fast-forward the animation, and stop it. The buttons function in a way similar to those on a standard video cassette player.
- Replay Speed
controls the playback speed for the animation. Move the Replay Speed slider bar to the left to reduce the playback speed (and to the right to increase it).
- Animation Sequences
contains the controls that you use to define the sequence to be played back.
- Sequences
contains a list of the animation sequences that have been defined.
- Delete
deletes the animation sequence that is selected in the Sequences list.
- Delete All
deletes all animation sequences in the Sequences list.
- Write/Record Format
specifies Animation Frames, Picture Files, or Video File as the format in which to save the animation. See Saving an Animation Sequence for details about these options.
- Picture Options...
opens the Save Picture Dialog Box where you can specify parameters for saving the animation to picture files. This button is available only when Picture Files is selected as the Write/Record Format.
- Video Options...
opens the Video Options Dialog Box where you can specify parameters for saving the animation to video files. This button is available only when Video File is selected as the Write/Record Format.
- Video Name
is the name that the video file will be saved with. This field is available only when Video File is selected as the Write/Record Format.
- Write
saves the specified file(s) in the current working directory in many cases. However, the animation may be written at the same location as the animation sequence file.
- Read...
opens The Select File Dialog Box, in which you can specify the name of the solution animation file to be read. See Reading an Animation Sequence for details.
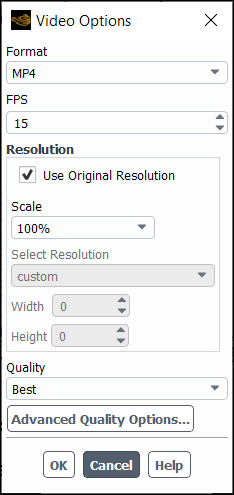
The Video Options dialog box allows you control how an animation file is saved in video format. See Video File for additional information.
Controls
- Format
specifies the format of the saved video file.
- FPS
specifies the target frames per second (FPS) for the saved video file.
- Resolution
contains the settings that control the resolution of the saved video file.
- Use Original Resolution
saves the video file in the same resolution as its comprising images (2D formats—ppm, png, jpeg, tiff) or using the current graphics window size (HSF, in-memory).
- Scale
control the scale of the saved video file.
- Select Resolution
contains common pre-defined video resolutions. This option is only available when Use Original Resolution is disabled.
- Width
displays the width, in pixels, of the saved video file. This option is only available and populated when Use Original Resolution is disabled.
- Height
displays the height, in pixels, of the saved video file. This option is only available and populated when Use Original Resolution is disabled.
- Quality
specifies the quality of the saved video file which may affect the final file size in addition to the video picture quality..
opens the Advanced Video Quality Options Dialog Box where you can access advanced controls for the video file quality.
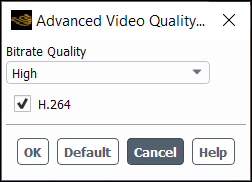
The Advanced Video Quality Options dialog box allows you to control additional options for the quality of a saved animation video file. Refer to Video File for additional information.
Controls
- Bitrate Quality
specifies the bitrate quality of the saved video file.
- H.264
uses the H.264 compression technique when writing the video file.
resets the fields to the default settings.
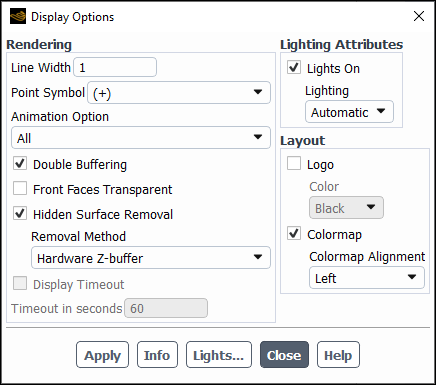
The Display Options dialog box provides an interactive mechanism for setting attributes or options that control how and where a scene is rendered.
Controls
- Rendering
allows you to modify characteristics of the display that are related to the way in which scenes are rendered. See Modifying the Rendering Options for details about these items.
- Line Width
controls the thickness of lines. The default is 1.
- Point Symbol
sets the symbol used for nodes and data points.
- Animation Option
contains a drop-down list of animation options: All and Wireframe. Wireframe uses a wireframe representation of all geometry during mouse manipulation This option is turned on by default. You should turn it off only if your computer has a graphics accelerator; otherwise the mouse manipulation may be very slow.
- Double Buffering
turns double buffering on or off, if it is supported by the driver. Double buffering dramatically reduces screen flicker during graphics updates. Note that if your display hardware does not support double buffering and you turn this option on, double buffering will be done in software. Software double buffering uses extra memory.
- Front Faces Transparent
allows you to turn off the display of outer faces in wall zones. Making the Front Faces Transparent is useful for displaying both sides of a slit wall. By default, when you display a slit wall, one side will "bleed" through to the other. When you turn on the Front Faces Transparent option, the display of a slit wall will show each side distinctly as you rotate the display. This option can also be useful for displaying two-sided walls (walls with fluid or solid cells on both sides).
- Hidden Surface Removal
turns hidden surface removal on or off. If you do not use hidden surface removal, Ansys Fluent will not try to determine which surfaces in the display are behind others; it will display all of them, and a cluttered display will result. You should turn this option off if you are working with a 2D problem or with geometries that do not overlap.
- Removal Method
chooses the method to be used for hidden surface removal. These options vary in speed and quality, depending on the device you are using. The choices are listed below.
- Hardware Z-buffer
is the fastest method if your hardware supports it. The accuracy and speed of this method is hardware dependent.
- Painters
will show fewer edge-aliasing effects than hardware-z-buffer. This method is often used instead of software-z-buffer when memory is limited.
- Software Z-buffer
is the fastest of the accurate software methods available (especially for complex scenes), but it is memory intensive.
- Z-sort only
is a fast software method, but it is not as accurate as software-z-buffer.
- Timeout in seconds
specifies the value for the timeout.
- Lighting Attributes
controls lighting attributes for all lights in the active graphics window. See Adding Lights for details.
- Lights On
turns all lights in the active graphics window on or off.
- Lighting
specifies the method to be used in lighting interpolation: Automatic, Flat, Gouraud, or Phong. Automatic automatically selects the best lighting method for the type of display in the graphics window. (Flat is the most basic method: there is no interpolation within the individual polygonal facets. Gouraud and Phong have smoother gradations of color because they interpolate on each facet.)
- Layout
controls the display of captions, axes and the colormap in the graphics display window. See Changing the Legend Display for details.
- Logo
allows you to hide or display the ANSYS logo.
- Color
contains a drop-down list of colors that can be used for the logo. The choices are White or Black.
- Colormap
enables/disables the display of the color scale.
- Colormap Alignment
allows you to adjust the alignment of colormap in the graphics display. Select the side (Top, Bottom, Left, and Right) from the drop-down list, where you want to align the colormap.
- Apply
updates how new graphics objects will appear. Note that some changes, such as those to line width and the logo are updated in all applicable graphics windows once you click .
- Info
prints out information about your graphics driver in the console.
- Lights...
opens the Lights Dialog Box, which allows you to create, delete, and modify directional light sources.
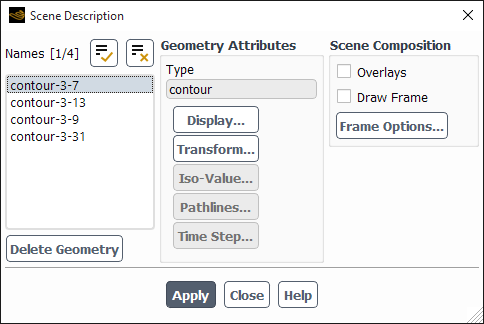
The Scene Description dialog box allows you to turn overlays on and off, select geometric objects in the display for modification or deletion, and open dialog boxes that control various characteristics of the selected object(s). (Note that you cannot use the Scene Description dialog box to control XY plot and histogram displays.) See Advanced Scene Composition for details about the items below.
Controls
- Names
contains a list of the geometric objects that currently exist in the scene (including those that are presently invisible). You can specify the object or objects to be manipulated by selecting names in this list. If you select more than one object at a time, any operation (transformation, color specification, and so on) will apply to all the selected objects. You can also select objects by clicking on them in the graphics display using the mouse probe button, which is, by default, the right mouse button. (See Controlling the Mouse Button Functions for information about mouse button functions.) To deselect a selected object, simply click its name in the Names list. See Selecting the Object(s) to be Manipulated for details.
- Geometry Attributes
contains information about the type of the selected geometric object and push buttons that open dialog boxes for modifying the object.
- Type
reports the type of the selected object. Possible types include
mesh,surface,contour,vector, andGroup. This information is especially helpful when you need to distinguish two or more objects with the same name. When more than one object is selected, the type displayed isGroup.- Display...
opens the Display Properties Dialog Box, which allows you to change the color, visibility, and other properties for the selected object.
- Transform...
opens the Transformations Dialog Box, which allows you to translate, rotate, and scale the selected object.
- Iso-Value...
opens the Iso-Value Dialog Box, which allows you to change the isovalue of an isosurface. This push button is available only if the geometric object selected in the Names list is an isosurface or an object on an isosurface (contour on an isosurface, for example); otherwise it is grayed out.
- Pathlines...
opens the Pathline Attributes Dialog Box, which allows you to set the maximum number of steps for the selected pathlines.
- Scene Composition
contains controls for enabling overlays and bounding frames.
- Overlays
activates the superimposition of a new geometry onto a currently displayed geometry. See Advanced Graphics Overlays for details.
- Draw Frame
activates the display of a bounding frame in the graphics display. See Adding a Bounding Frame for details.
- Frame Options...
opens the Bounding Frame Dialog Box, in which you can define properties of the bounding frame. See Adding a Bounding Frame for details.
- Delete Geometry
deletes the geometric object that is currently selected in the Names list. The ability to delete individual objects is especially useful if you have overlays on and you generate an unwanted object (for example, if you generate contours of the wrong variable). You can simply delete the unwanted object and continue your scene composition, instead of starting over from the beginning.
- Apply
saves the status of Overlays and Draw Frame. When you turn Overlays or Draw Frame on or off, you must click the Apply button to see the effect of the change on subsequent display operations.
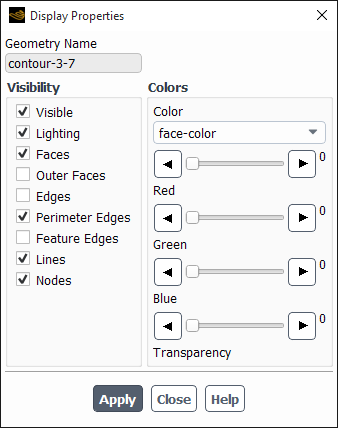
To modify the color, visibility, and other display properties for individual geometric objects in the graphics display, use the Display Properties dialog box. You can open this dialog box by clicking the Display... push button in the Scene Description Dialog Box. See Changing an Object’s Display Properties for details about the items below.
Controls
- Geometry Name
displays the name of the object you selected for modification in the Scene Description Dialog Box.
- Visibility
contains check buttons that control options related to the visibility of the selected object. See Controlling Visibility for details.
- Visible
toggles the visibility of the selected object. If it is turned on, the object will be visible in the display, and if it is turned off, the object will be invisible.
- Lighting
turns the effect of lighting for the selected object on or off. You can choose to have lighting affect only certain objects instead of all of them. Note that if Lighting is turned on for an object such as a contour or vector plot, the colors in the plot will not be exactly the same as those in the colormap at the left of the display.
- Faces
toggles the filled display of faces for the selected mesh or surface object. Turning Faces on has the same effect as turning on the display of faces in the Mesh Display Dialog Box.
- Outer Faces
toggles the display of outer faces.
- Edges
toggles the display of interior and exterior edges of the geometric object.
- Perimeter Edges
toggles the display of the outline of the geometric object. (This option has no effect on the display of meshes.)
- Feature Edges
toggles the display of feature lines (if any) of the geometric object.
- Lines
toggles the display of the lines (if any) in the geometric object.
- Nodes
toggles the display of the nodes (if any) in the geometric object.
- Colors
contains controls for setting face, edge, line, and node colors, and transparency for faces. See Controlling Object Color and Transparency for details.
- Color
specifies the face, edge, line, or node color for modification. When you turn on this button, the color scales below will show the current color specification, which you can modify by moving the sliders on the color scales.
- Red, Green, Blue
are color scales with which you can specify the RGB components of the face, edge or line color.
- Transparency
sets the relative transparency of the selected object. An object with a transparency of 0 is opaque, and an object with a transparency of 100 is transparent.
You can use the Transformations dialog box to translate, rotate, or scale individual objects in the graphics display. To open this dialog box, click the Transform... push button in the Scene Description Dialog Box. See Transforming Geometric Objects in a Scene for details about the items below.
Controls
- Geometry Name
displays the name of the object you selected for modification in the Scene Description Dialog Box.
- Meridional
(3D only) enables the display of the meridional view. This option is especially useful in turbomachinery applications.
- Translate
contains X, Y, and Z real number fields in which you can enter the distance by which to translate the selected object in each direction.
- Rotate by
contains X, Y,and Z integer number fields in which you can enter the number of degrees by which to rotate the selected object about each axis.
- Rotate about
specifies the point about which to rotate the object.
- Scale
contains X, Y, and Z real number fields in which you can enter the amount by which to scale the selected object in each direction. To avoid distortion of the object’s shape, be sure to specify the same value for all three entries.
The Iso-Value dialog box allows you to change the isovalue of an isosurface. The isosurface can be selected directly in the Names list or indirectly by selecting an object displayed on the isosurface. When you change the isovalue, any contours, vectors, and so on that were displayed on the original isosurface will be displayed on the isosurface with the new isovalue. To open this dialog box, click the Iso-Value... push button in the Scene Description Dialog Box. See Modifying Iso-Values for details about using this dialog box.

Controls
- Geometry Name
displays the name of the geometric object (isosurface) you selected for modification in the Scene Description Dialog Box.
- Min, Max
show the minimum and maximum values of the isosurface variable.
- Value
sets the new isovalue for isosurfaces. After you change the value and click Apply, contours, vectors, or pathlines that were displayed on the original isosurface will be displayed for the new isovalue. You can also use the slide bar to change the Value.
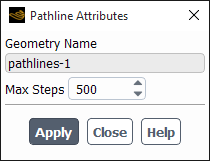
The Pathline Attributes dialog box allows you to change the number of steps used in the computation of pathlines. This is most useful in creating animations of pathlines. To open this dialog box, click the Pathlines... button in the Scene Description Dialog Box. See Modifying Pathline Attributes for details about using this dialog box.
Controls
- Geometry Name
displays the name of the geometric object you selected for modification in the Scene Description Dialog Box.
- Max Steps
sets the new maximum number of steps for pathline computation. After you change the value and click Apply, the selected pathline will be recomputed and redrawn.
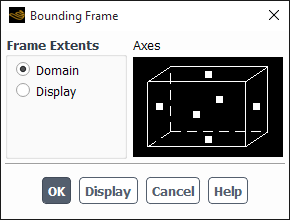
The Bounding Frame dialog box allows you to add a bounding frame with optional measure markings to the display of the domain. See Adding a Bounding Frame for details about the items in this dialog box.
Controls
- Frame Extents
indicates the extents of the bounding frame.
- Domain
specifies that the frame should encompass the domain extents.
- Display
specifies that the frame should encompass the portion of the domain that is shown in the display.
- Axes
contains controls for specifying the frame boundaries and measurements. See Adding a Bounding Frame for instructions on using these items.
- Display
updates the active graphics window with the current frame settings.
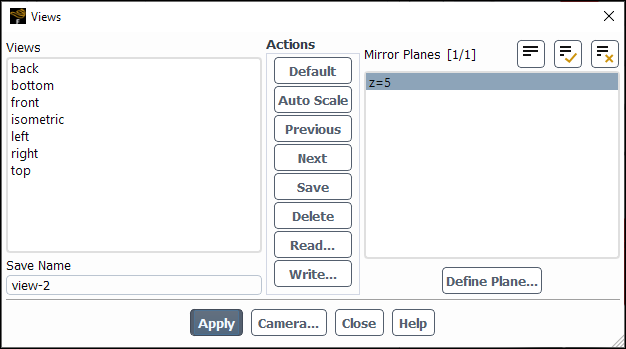
With the Views dialog box, you can make various modifications to the view displayed in the active graphics window. See Controlling the Display State and Modifying the View for details about the items below.
Controls
- Views
lists the currently defined views. Clicking on a view name highlights that name and enters it into the Name field. Double-clicking on a view name restores that view in the active graphics window.
- Save Name
specifies the name to use when saving a view.
- Actions
contains buttons for performing various actions related to the Views list and the Save Name.
- Default
restores the "front" view in the active graphics window.
- Auto Scale
modifies the view in the active graphics window by scaling and centering the current scene without changing its orientation.
- Previous
allows you to return to previous displays.
- Save
stores the view in the active graphics window with the name in the Save Name box. See Saving Views for details.
- Delete
removes the selected view name from the Views list.
Important: Be careful not to delete any of the pre-defined views.
- Read...
opens The Select File Dialog Box, in which you can specify the name of a view file to be read. See Reading View Files for details.
- Write...
opens the Write Views Dialog Box, in which you can select the views to be saved to a view file. See Saving Views for details.
- Mirror Planes
displays a list of all symmetry planes in the domain. Mirror images are drawn for all selected symmetry planes. See Mirroring and Periodic Repeats for details.
- Define Plane...
opens the Mirror Planes Dialog Box, in which you can define a mirror plane for a non-symmetric domain.
- Camera...
opens the Camera Parameters Dialog Box.
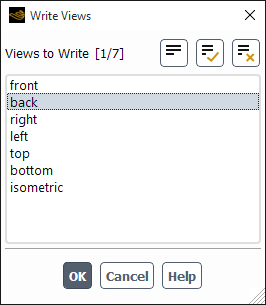
The Write Views dialog box allows you to save selected views to a view file. To open it, click Write... in the Views Dialog Box. This feature allows you to transfer views between case files. See Saving Views for details.
Controls
- Views to Write
is a selectable list of the defined views. The selected views will be saved to a view file when you click .
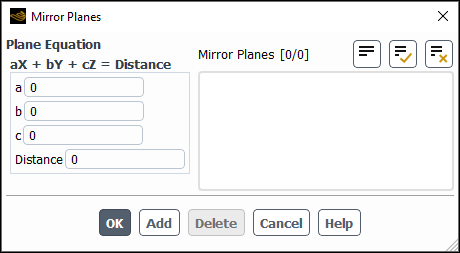
The Mirror Planes dialog box allows you to define a symmetry plane for a non-symmetric domain for use with graphics. To open it, click Define Plane... in the Views Dialog Box. See Mirroring for Graphics for details.
Controls
- Plane Equation
contains inputs for specifying the equation for the mirror plane: coefficients a, b, c, and Distance.
- Mirror Planes
contains a list of all mirror planes you have defined using this dialog box. (Mirror planes that exist in the domain due to symmetry will not appear in this list, since they cannot be modified.)
- Add
adds the plane defined by the Plane Equation to the Mirror Planes list.
- Delete
deletes the plane(s) selected in the Mirror Planes list.
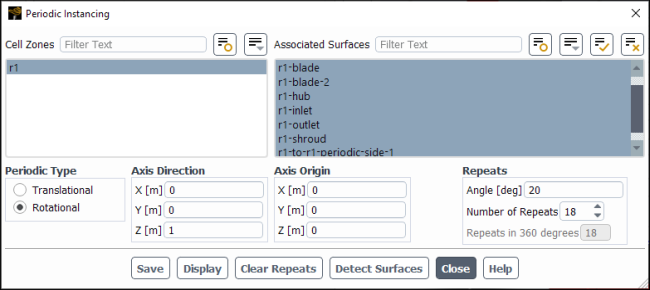
The Periodic Instancing dialog box allows you to define a periodic repeats, periodic rotation or translation for a non-periodic domain for use with graphics. To open it, click Periodic Instancing... in the View ribbon tab (Display group box). See Periodic Repeats for Graphics for details.
Controls
- Cell Zones
contains the list of the zones in the mesh. You can select one or more zones in this list and specify different periodicity parameters for each zone separately.
- Associated Surfaces
contains the list of the surfaces associated with the selected cell zone.
- Periodic Type
specifies Rotational or Translational periodicity.
- Angle
specifies the angle by which the domain is rotated to create the periodic repeat. This item is available when you select Rotational as the Periodic Type.
- Translation
specifies the distance in the X, Y, and Z directions by which the domain is translated to create the periodic repeat. This item will appear when you select Translational as the Periodic Type.
- Axis Direction
specifies the direction vector (X,Y,Z) for the axis of rotation. This item is available when you select Rotational as the Periodic Type and the domain is three-dimensional.
- Axis Origin
specifies the origin of the axis of rotation. This item is available when you select Rotational as the Periodic Type.
- Number of Repeats
specifies the number of times you want to repeat the periodic domain. Positive values repeat the zone in the direction of rotation. Negative values repeat the zone in the opposite direction of rotation.
saves the periodicity you have defined for the case setup.
saves the current settings and displays the results.
Important: The surfaces you want to see repeated or translated must already be displayed in the graphics window for you to see any changes in the contents of the graphics window when you click (for example, mesh display, contours, and so on).
Resets the Number of Repeats to
1and saves the settings change.Fluent automatically assesses the loaded case file and selects what it thinks are the appropriate cell zones, surfaces, and other settings (such as angle and number of repeats) for this problem, and saves them.
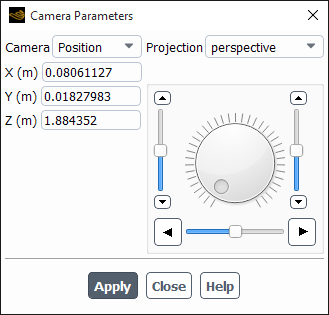
The Camera Parameters dialog box allows you to modify the "camera" through which you are viewing the graphics display. See Controlling Perspective and Camera Parameters for details about the items below.
Controls
- Camera
contains a drop-down list of the parameters that define the camera (Position, Target, Up Vector, and Field) and X, Y, and Z fields in which you can define the coordinates or field distances for the parameter selected in the drop-down list. Figure 40.91: Camera Definition illustrates the definition of the camera by these parameters.
- Projection
contains a drop-down list that allows you to select a Perspective or Orthographic view.
- (Dial and Sliders)
allow you to rotate and scale the graphics display. The slider on the scale to the left of the dial rotates the display about the horizontal axis at the center of the screen, the slider on the scale below the dial rotates the display about the vertical axis at the center of the screen, and the dial controls rotation about the axis at the center of and perpendicular to the screen. The slider on the scale to the right of the dial zooms in or out in the display. See Rotating the Display and Zooming the Display for details.
Important: When you are using the sliders and dial to manipulate the view, you may want to turn off Wireframe Animation in the Display Options Dialog Box, so that you can watch the display move interactively while you are moving the slider or the dial indicator.
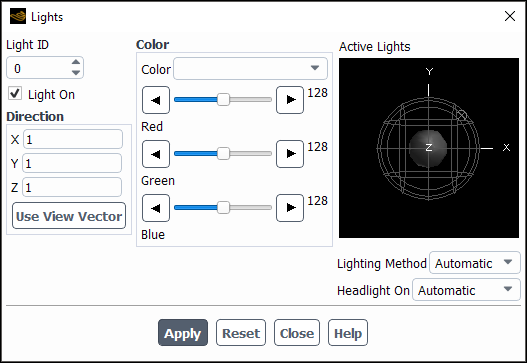
The Lights dialog box provides an interactive mechanism for placing colored, directional lights in a scene. See Adding Lights for details about the items below.
Controls
- Light ID
indicates the light that is being added, deleted, or modified. By default, light 1 is defined to be dark gray with a direction of (1,1,1).
- Light On
indicates whether or not the light specified in Light ID is on or off. By turning off the Light On option for a particular light, you can remove this light from the display, while still retaining its definition. To add it to the display again, simply turn on the Light On button.
- Direction
allows you to specify the direction of the light (the position on the unit sphere from which the light emanates) by entering the X, Y, and Z coordinates or by computing the coordinates based on the current view in the graphics window.
- X,Y,Z
specify the direction of the light. For example, the direction (1,1,1) means that the rays from the light will be parallel to the vector from (1,1,1) to the origin.
- Use View Vector
updates the X,Y,Z fields with the appropriate values for the current view in the active graphics window, and shines a light in that direction. Instead of entering the X,Y,Z values for a light’s direction vector, you can use your mouse to change the view in the graphics window so that your position in reference to the geometry is the position from which you would like a light to shine. You can then click the Use View Vector button to update the X,Y,Z fields with the appropriate values for your current position and update the graphics display with the new light direction. This method is convenient if you know where you want a light to be, but you are not sure of the exact direction vector.
- Color
allows you to specify the light color with sliders. You can create your desired color by increasing and decreasing the slider values for the colors Red, Green, and Blue. You can also enter a descriptive string (for example, lavender) in the Color field.
- Active Lights
shows the position and color of all defined directional lights, and allows you to change the position of a light. All directional lights in Ansys Fluent are assumed to be at infinity and pass through the unit sphere at the position shown. All light rays arriving at the scene from one light are parallel. The colored markers on the surface of the sphere represent the color and direction of these distant lights. These lights point towards the center of the sphere (the origin, which is usually where the geometry is).
- Lighting Method
specifies the method to be used in lighting interpolation: Automatic, Off, Flat, Gouraud, or Phong. (Flat is the most basic method: there is no interpolation within the individual polygonal facets. Gouraud and Phong have smoother gradations of color because they interpolate on each facet.) When Off is selected, lighting effects are disabled.
- Headlight On
enables constant lighting effects in the direction of the view. The Automatic option automatically enables/disables the headlight depending on the type of display in the graphics window.
- Reset
resets the light definitions to their last saved state (the lighting that was in effect the last time you opened the dialog box or clicked on Apply).
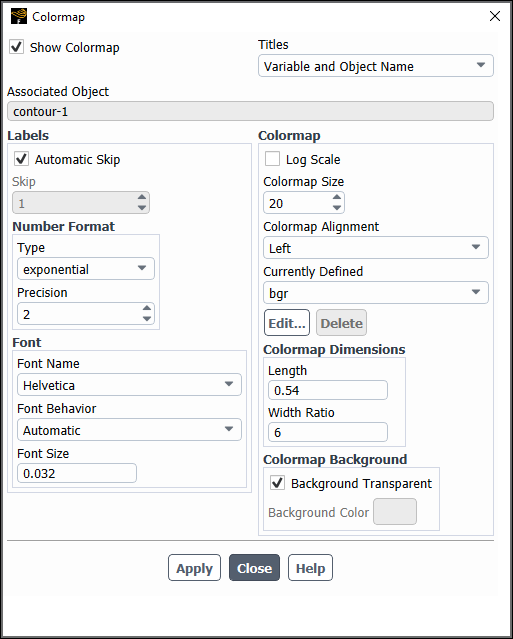
The Colormap dialog box allows you to select and modify existing colormaps. See Selecting a Colormap for details.
Controls
- Show Colormap
this option is only visible when accessed through a graphics object dialog box, such as Contours or Vectors. It allows you to turn the display of the colormap in the graphics window on/off.
Alternatively, you can temporarily hide a colormap by clicking the 'X' that appears in the upper-right of the colormap when you hover over it in the graphics window. There is also a context menu option to temporarily show a hidden colormap. Refer to Changing the Colormap and Range for additional information.
- Titles
controls what identifying titles are displayed on the colormap. The options include:
Variable and Object Name—both the variable name and the associated graphics object are listed with the colormap, along with the units.
Variable Only—only the variable name and the units are listed with the colormap.
None—only the units are listed with the colormap.
- Labels
allows you to customize the display of your colormap labels.
- Automatic Skip
automatically skips enough labels so that they are all legible. Disabling will display the number of labels determined by the Skip and Colormap Size fields.
- Skip
sets the number of labels to be skipped.
- Number Format
contains controls for changing the format of the labels on the color scale. These labels are the character strings used to define the color divisions at the left of the graphics window.
- Type
sets the form of the labels. You may select from a drop-down list of options, including the following:
- general
displays the real value with either float or exponential form based on the size of the number and the defined Precision.
- float
displays the real value with an integral and fractional part (for example, 1.0000), where the number of digits in the fractional part is determined by Precision.
- exponential
displays the real value with a mantissa and exponent (for example, 1.0e-02), where the number of digits in the fractional part of the mantissa is determined by Precision.
- Precision
defines the number of fractional digits displayed in the labels.
- Font
allows you to customize the display of your colormap font.
- Font Name
lists the available colormap fonts.
- Font Behavior
controls whether the font size updates automatically when the colormap is resized or if the font is always a fixed size.
- Font Size
when is set to Automatic, this field controls the font size as a percentage of the colormap size. When the Font Behavior is set as Fixed, you can set the Font Size to a fixed size that is familiar from word processors.
- Colormap
contains controls for the colormap size and scale, and for selection of a defined colormap.
- Log Scale
enables the use of a logarithmic scale for the color scale (rather than the default decimal scale). See Specifying the Colormap Size and Scale for details.
- Colormap Size
specifies the number of distinct colors in the colormap. You may specify from 2 to 100 colors.
- Currently Defined
contains a drop-down list of all pre-defined colormaps and all custom colormaps defined by you. Select the colormap to be used from this list.
- Edit...
opens the Colormap Editor Dialog Box, in which you can create a custom colormap.
- Delete
Delete the colormap that is selected in the drop-down list.
Note:You can only delete user-defined colormaps, not the ones that come with Ansys Fluent.
If you delete a user-defined colormap that is assigned to a graphics object, the graphics object will revert to the colormap selected in the Colormap field in Preferences (Graphics branch, under Colormap Settings).
- Colormap Dimensions
allows you to customize the "physical" size of your colormap in the graphics window.
- Length
controls the "height" for vertical colormaps, or the "length" for horizontal colormaps, as a percentage of graphics window height or width, respectively.
- Width Ratio
controls the "width" of a vertical colormap or the "height" of a horizontal colormap, as a ratio of the Length field. Decreasing the Width Ratio increases the "width" or "height" of the colormap, respectively.
- Colormap Background
allows you to control the appearance of the colormap background.
- Background Transparent
enabling this option makes the background of the colormap transparent.
- Background Color
specifies which color will be used for the colormap background when the Background Transparent option is disabled.
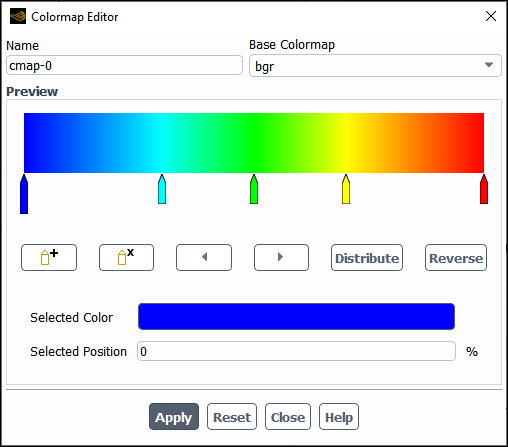
The Colormap Editor dialog box allows you to create custom colormaps. See Creating a Customized Colormap for details about the items below.
Controls
- Name
is the name that will be applied to the modified colormap.
- Base Colormap
is the baseline colormap that you are modifying. You can use this drop-down list to select a different baseline colormap.
- Preview
allows you to interactively modify the colormap. Drag the "stops" (
 ) to modify the color and color distribution.
- Add Stop
clicking "add stop" (
 ) adds another color stop next to the selected stop.
- Remove Stop
clicking "remove stop" (
 ) removes the selected color stop.
- Left Arrow
clicking the left arrow (
 ) selects the next stop to the left.
- Right Arrow
clicking the right arrow (
 ) selects the next stop to the left.
- Distribute
evenly distributes the stops on the colormap.
- Reverse
reverses the colors on the colormap.
- Selected Color
shows the color of the selected stop. Clicking the colored field to the right, opens the Select Color dialog box, allowing you to choose a different color for the selected stop.
- Selected Position
shows the position in the colormap of the selected stop as a percentage, with 0% being the left-most stop and 100% being the right-most stop.
- Apply
saves the colormap with the name displayed in the Name field. Note that you cannot overwrite the system colormaps that come with Ansys Fluent.
- Reset
resets the preview to match the Base Colormap.
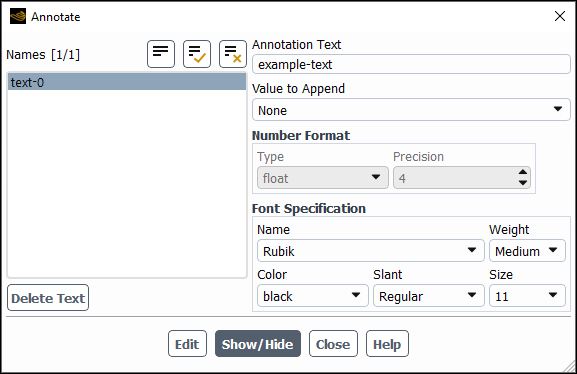
You can use the Annotate dialog box to add text with optional attachment lines to the graphics windows, or to modify existing text. See Adding Text Using the Annotate Dialog Box for details about the items below.
Controls
- Names
contains a selectable list of all annotation text strings that have been defined. You can choose a text string to be deleted or edited.
- Delete Text
deletes the text strings selected in the Names list from the display.
- Annotation Text
contains the annotation text string you want to add, or the annotation text string for the item selected in the Names list.
- Value to Append
allows you to add the following items to the Annotation Text.
Date
Time
Version
Number of iterations
Number of timesteps
Flow time
<any defined expressions>
- Number Format
contains controls for specifying how appended flow time values are displayed.
- Type
controls whether values are displayed as floats.
- Precision
specifies how many significant digits are used in the displayed flow time or expressions.
- Font Specification
contains controls for defining or modifying the font in the annotation text string.
- Name
contains a drop-down list of various font styles.
- Weight
contains a drop-down list from which you can select Medium or Bold.
- Color
contains a drop-down list of colors that can be used for the text.
- Slant
contains a drop-down list from which you can select Regular or Italic as the slant type.
- Size
contains a drop-down list of font sizes (in points).
- Add
adds the current Annotation Text to the active graphics window. A dialog box will prompt you to select a screen location using the left-mouse-button.
If you click the mouse button once in the desired location, the text will be placed at that point. Dragging the mouse with the left-mouse-button depressed will draw an attachment line from the point where the mouse was first clicked to the point where it was released. The annotation text will be placed at the point where the mouse button was released.
- Show/Hide
shows or removes the defined annotations.
- Edit
updates the edited text in the active graphics window. This button will replace the Add button when you are editing an existing text string from the Names list.