


Figure 40.100: The Scene Description Dialog Box allows you to create a more complex scene than what you can create using Figure 40.50: The Scene Dialog Box.
Once you have displayed some geometric objects (meshes, surfaces, contours, vectors, and so on) in your graphics window, you may want to move them around and change their characteristics to increase the effectiveness of the scene displayed. You can use the Scene Description Dialog Box (Figure 40.100: The Scene Description Dialog Box) and the Display Properties Dialog Box (Figure 40.101: The Display Properties Dialog Box) and Transformations Dialog Box (Figure 40.103: The Transformations Dialog Box), which are opened from within it, to rotate, translate, and scale each object individually, as well as change the color and visibility of each object.
![]() View → Graphics
→ Compose...
View → Graphics
→ Compose...
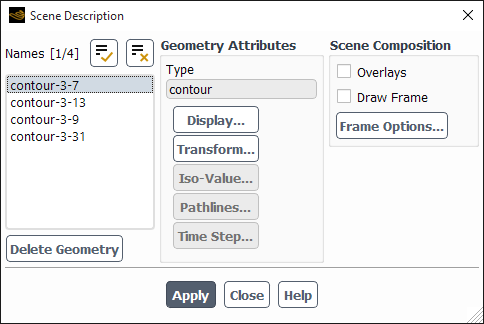
The Iso-Value Dialog Box (Figure 40.104: The Iso-Value Dialog Box), which is also opened from within the Scene Description Dialog Box, enables you to change the isovalue of a selected isosurface. The Pathline Attributes Dialog Box (Figure 40.105: The Pathline Attributes Dialog Box) lets you set some pathline attributes. The ability to make geometric objects visible and invisible is especially useful when you are creating an animation (see Animating Graphics) because it enables you to add or delete objects from the scene one at a time. The ability to change the color and position of an object independently of the others in the scene is also useful for setting up animations, as is the ability to change isosurface isovalues. You will find the features in the Scene Description Dialog Box useful even when you are not generating animations because they enable you to manage your graphics window efficiently. The procedure for overlaying graphics, which uses the Scene Description dialog box, is described in Advanced Graphics Overlays. (Note that you cannot use the Scene Description Dialog Box to control XY plot and histogram displays.)
For additional information, see the following sections:
In order to manipulate the objects in the scene, you will begin by selecting the object or objects of interest in the Names list in the Scene Description Dialog Box (Figure 40.100: The Scene Description Dialog Box). The Names list is a list of the geometric objects that currently exist in the scene (including those that are presently invisible). If you select more than one object at a time, any operation (transformation, color specification, and so on) will apply to all the selected objects. You can also select objects by clicking on them in the graphics display using the mouse-probe button, which is, by default, the right mouse button. (See Controlling the Mouse Button Functions for information about mouse button functions.) To deselect a selected object, simply click its name in the Names list.
When you select one or more objects (either in the Names list or in the display), the Type field will report the type of the selected object(s). Possible types
for a single object include mesh, surface, contour, vector, path, and text (that is, annotation text). This information is
especially helpful when you need to distinguish two or more objects
with the same name. When more than one object is selected, the type
displayed is Group.
To enhance the scene in the graphics window, you can change the color, visibility, and other display properties of each geometric object in the scene. You can specify different colors for displaying the edges and faces of a mesh object to show the underlying mesh (edges) when the faces of the mesh are filled and shaded. You can also make a selected object temporarily invisible. If, for example, you are displaying the entire mesh for a complicated problem, you can make objects visible or invisible to display only certain boundary zones of the mesh without regenerating the mesh display using the Mesh Display Dialog Box. You can also use the visibility controls to manipulate geometric objects for efficient graphics display or for the creation of animations. These features, plus several others, are available in the Display Properties Dialog Box (Figure 40.101: The Display Properties Dialog Box).
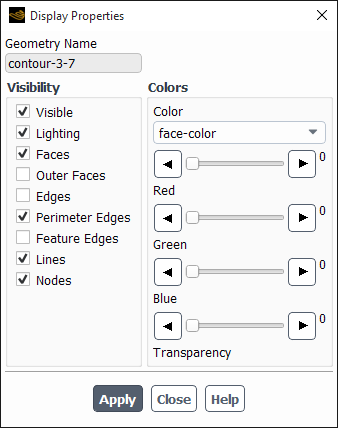
To set the display properties described above, select one or more objects in the Names list in the Scene Description Dialog Box and then click to open the Display Properties Dialog Box for that object or group of objects.
There are several ways for you to control the visibility of an object. All visibility options are listed under the Visibility heading in the Display Properties Dialog Box.
To make the selected object(s) invisible, turn off the Visible option. To “undo” invisibility, enable the Visible option again.
To turn the effect of lighting for the selected object(s) on or off, use the Lighting check box. You can choose to have lighting affect only certain objects instead of all of them. Note that if Lighting is turned on for an object such as a contour or vector plot, the colors in the plot will not be exactly the same as those in the colormap at the left of the display.
To toggle the filled display of faces for the selected mesh or surface object(s), use the Faces option. Turning Faces on here has the same effect as turning it on for the entire mesh in the Mesh Display Dialog Box.
To turn the display of outer edges on or off, use the Outer Faces option. This option is useful for displaying both sides of a slit wall. By default, when you display a slit wall, one side will “bleed” through to the other. When you turn off the Outer Faces option, the display of a slit wall will show each side distinctly as you rotate the display. This option can also be useful for displaying two-sided walls (that is, walls with fluid or solid cells on both sides).
To turn the display of interior and exterior edges of the geometric object(s) on or off, use the Edges option.
To turn the display of the outline of the geometric object(s) on or off, use the Perimeter Edges check box.
To toggle the display of feature lines (described in Adding Features to an Outline Display), if any, for the selected object(s), use the Feature Edges option.
To toggle the display of the lines (if any) in the geometric object(s), use the Lines check box. Pathlines, line contours, and vectors are “lines”.
To toggle the display of nodes (if any) in the geometric object(s), use the Nodes check box.
Once you have set the appropriate display parameters, click to update the graphics display.
The Display Properties Dialog Box also lets you control an object’s color and how transparent it is. All color and transparency options are listed under the Colors heading.
To modify the color of faces, edges, or lines in the selected object(s), choose face-color, edge-color, line-color, or node-color in the Color drop-down list. The Red, Green, and Blue color scales will show the RGB components of the face, edge or line color, which you can modify by moving the sliders on the color scales. When you are satisfied with the color specification, click to save it and update the display. The ability to set the colors for faces and edges can be useful when you want to have a filled display for the mesh or surface, but you also want to be able to see the mesh lines. You can achieve this effect by specifying different colors for the faces and the edges.
To set the relative transparency of an object, select face-color in the Color drop-down list. Move the slider on the Transparency scale and click to update the graphics display. An object with a transparency of 0 is opaque, and an object with a transparency of 100 is transparent. By specifying a high transparency value for the walls of a pipe, for example, you will be able to see contours that you have displayed on cross-sections inside the pipe. This feature is available on all platforms when the software
 buffer is used for hidden
surface removal, but if your display hardware supports transparency,
it will be more efficient to use the hardware
buffer is used for hidden
surface removal, but if your display hardware supports transparency,
it will be more efficient to use the hardware  buffer as the hidden surface
method instead. You can select these methods in the Display Options Dialog Box, as described in Modifying the Rendering Options.
buffer as the hidden surface
method instead. You can select these methods in the Display Options Dialog Box, as described in Modifying the Rendering Options.
Important: If you save a picture of a display with transparent surfaces, you should not set the File Type in the Save Picture Dialog Box to Vector.
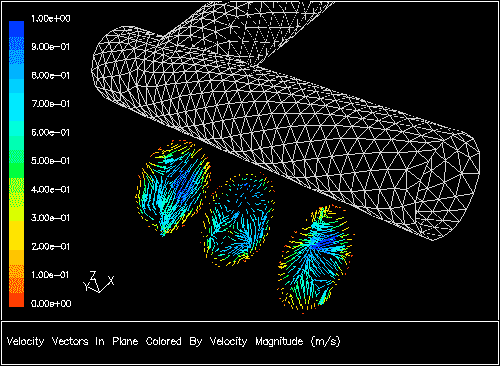
When you are composing a scene in your graphics window, you might find it helpful to move a particular object from its original position or to increase or decrease its size. For example, if you have displayed contours or vectors on cross-sections of an internal flow domain (such as a pipe), you might want to translate these cross-sections so that they will appear outside of the pipe, where they can be seen and interpreted more easily. Figure 40.102: Velocity Vectors Translated Outside the Domain for Better Viewing shows such an example.
You can also move an object by rotating it about the  -,
-,  -, or
-, or  -axis. If you want to display
one object more prominently than the others, you can scale its size.
If your geometry is rotating or has rotational symmetry, you can display
the meridional view. All of these capabilities are available in the Transformations Dialog Box (Figure 40.103: The Transformations Dialog Box).
-axis. If you want to display
one object more prominently than the others, you can scale its size.
If your geometry is rotating or has rotational symmetry, you can display
the meridional view. All of these capabilities are available in the Transformations Dialog Box (Figure 40.103: The Transformations Dialog Box).
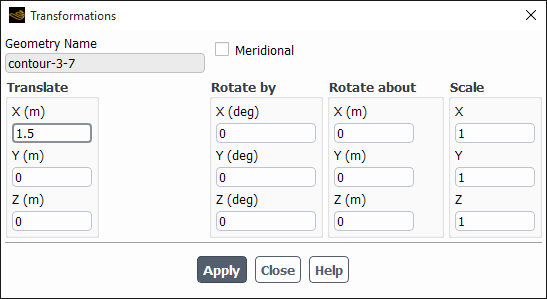
To perform the transformations described above, select one or more objects in the Names list in the Scene Description Dialog Box and then click to open the Transformations Dialog Box for that object or group of objects.
To translate the selected object(s), enter the translation distance in each direction in the X, Y, and Z real number fields under Translate. Note that you can check the domain extents in the Scale Mesh Dialog Box or the Iso-Surface Dialog Box. Translations are not cumulative, so you can easily return to a known state. To return to the original position, simply enter 0 in all three real number fields.
To rotate the selected object(s), enter the number of degrees
by which to rotate about each axis in the X, Y, and Z integer number fields under Rotate By. You can enter any value between  and
and  . By default, the
rotation origin will be (0,0,0). If you want to spin an object about
its own origin, or about some other point, specify the X, Y, and Z coordinates
of that point under Rotate About.
. By default, the
rotation origin will be (0,0,0). If you want to spin an object about
its own origin, or about some other point, specify the X, Y, and Z coordinates
of that point under Rotate About.
Rotations are not cumulative, so you can easily return to a known state. To return to the original position, simply enter 0 in all three integer number fields under Rotate By.
To scale the selected object(s), enter the amount by which to scale in each direction in the X, Y, and Z real number fields under Scale. To avoid distortion of the object’s shape, be sure to specify the same value for all three entries. Scaling is not cumulative, so you can easily return to a known state. To return the object to its original size, simply enter 1 in all three real number fields.
To display the meridional view of the selected object(s), enable the Meridional option. This option is available only for 3D models. It is applicable to cases with a defined axis of rotation and is especially useful in turbomachinery applications.
The meridional transformation projects the selected entities
onto a surface of constant angular coordinate,  . The resultant projection
thus lies in an (
. The resultant projection
thus lies in an ( ,
,  ) plane where
  is in the direction of
the rotation axis and
is in the direction of
the rotation axis and  is normal to it. The value of
  used for the projection
is taken as that corresponding to the minimum (
used for the projection
is taken as that corresponding to the minimum ( ,
,  ) point of the entity.
You can use the ability to generate surfaces with intermediate values between two isosurfaces (with different isovalues) to create snapshots of the results. If the surfaces have contours, vectors, or pathlines displayed on them, Ansys Fluent will generate and display contours, vectors, or pathlines on the intermediate surfaces that it creates.
You can modify an isosurface’s isovalue directly by selecting it in the Names list in the Scene Description Dialog Box or indirectly by selecting an object displayed on the isosurface. Then click to open the Iso-Value Dialog Box (Figure 40.104: The Iso-Value Dialog Box) for the selected object. Note that this button is available only if the geometric object selected in the Names list is an isosurface or an object on an isosurface (contour on an isosurface, for example); otherwise it is grayed out.

In the Iso-Value Dialog Box, set the new isovalue in the Value field, and click Apply. Contours, vectors, or pathlines that were displayed on the original isosurface will be displayed for the new isovalue.
If you are creating animations of existing pathlines, you may want to change the number of steps used in the computation of the pathlines. This enables you to animate pathlines advancing through the domain. To do so, select the pathlines in the Names list in the Scene Description Dialog Box and then click to open the Pathline Attributes Dialog Box (Figure 40.105: The Pathline Attributes Dialog Box).
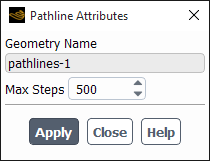
In the Pathline Attributes Dialog Box, set the new maximum number of steps for pathline computation (Max Steps). After you change the value and click , the selected pathline will be recomputed and redrawn.
If you are composing a complex scene with overlays and find that you no longer want to keep one of the objects, it is possible to delete it without affecting any of the other objects in the scene. The ability to delete individual objects is especially useful if you have overlays on and you generate an unwanted object (for example, if you generate contours of the wrong variable). You can simply delete the unwanted object and continue your scene composition, instead of starting over from the beginning. Note that it is also possible to make objects temporarily invisible, as described in Controlling Visibility.
Object deletion is performed in the Scene Description Dialog Box (Figure 40.100: The Scene Description Dialog Box). To delete an object from the scene, select it in the Names list and then click . The selected name will disappear from the Names list, and the display will be updated immediately.
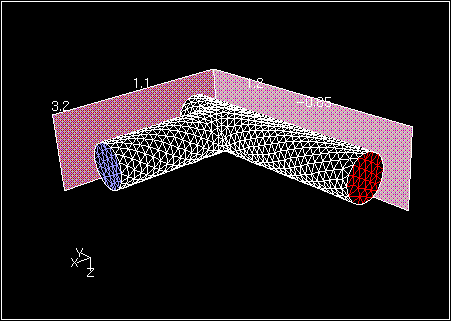
Ansys Fluent enables you to add a bounding frame around your displayed domain. You may also include measure markings on the bounding frame to indicate the length, height, and/or width of the domain, as shown in Figure 40.106: Graphics Display with Bounding Frame.
To add a bounding frame to your display, you will follow the procedure below:
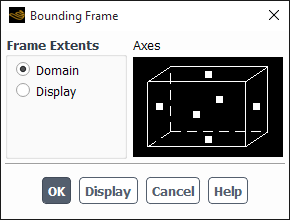
Click in the Scene Description Dialog Box (Figure 40.100: The Scene Description Dialog Box) to open the Bounding Frame Dialog Box (Figure 40.107: The Bounding Frame Dialog Box).
Under Frame Extents in the Bounding Frame Dialog Box, select Domain or Display to indicate whether the bounding frame should encompass the domain extents or only the portion of the domain that is shown in the display.
In the Axes portion of the Bounding Frame Dialog Box, specify the frame boundaries and measurements to be shown in the display:
Indicate the bounding plane(s) (for example, the x-z and y-z planes shown in Figure 40.106: Graphics Display with Bounding Frame) to be displayed by clicking on the white square on the appropriate plane of the box shown under the Axes heading. You can use any of the mouse buttons. The square will turn red to indicate that the associated bounding plane will be displayed in the graphics window.
Specify where you would like to see the measurement annotations by clicking on the appropriate edge of the box. The edge will turn red to indicate that the markings will be displayed along that edge of the displayed geometry.
Important: If you have trouble determining which square or edge corresponds to which location in your domain, you can easily find out by displaying one or two bounding planes to get your bearings. You can then select the appropriate objects to obtain the final display.
Click to update the display with the current settings. If you are not satisfied with the frame, repeat steps 2 and/or 3 and click again.
Once you are satisfied with the bounding frame that is displayed, click to close the Bounding Frame Dialog Box and save the frame settings for future displays.
If you want to include the bounding frame in all subsequent displays, enable the Draw Frame option in the Scene Description Dialog Box and click Apply. If this option is not enabled, the bounding box will appear only in the current display; it will not be redisplayed when you generate a new display (unless you have overlays enabled).
The bounding planes and axis annotations will appear in the Names list of the Scene Description Dialog Box, and you can manipulate them in the same way as any other geometric object in the display. For example, you can use the Display Properties Dialog Box to change the face color of a bounding plane or to make it transparent (see Changing an Object’s Display Properties).