


What kind of problem are you having?
I cannot remove the colored box around my 1-Way LBM or User Process selection
I cannot find the minimize, restore down, and close buttons for my maximized Rocky window
I want to analyze Property information for only one of my Particle sets
I do not understand how my Particle set names map to the Particle Group value numbers
I cannot find some Geometry Properties or Curves in this version of Rocky
Parts of my geometries and particles disappear when I rotate my 3D View
I have large discrepancies in my Intra-particle Collisions Statistics Frequency values
I cannot find the directional properties for Solid Implicit Force
See Also:
In this version of Rocky, the only way to zoom, pan, or tilt the image in the 3D View window is to use the mouse.
See Also:
In Rocky, some data is collected automatically and some data you must know to first opt in to collecting before you process your simulation. In addition, some data is always collected right from the start of the simulation, and some data waits to be collected until passing certain thresholds that you define.
To help you better understand how and when data is calculated, refer to the About Collecting Data in Rocky topic.
If you have saved a copy of your partially processed simulation (see also Save a Copy of a Partially Processed Simulation for Restart Purposes) and have opened it for the purpose of adding or modifying setup parameters (see also About Changing Geometries and/or Particles in a Partially Processed Simulation), the copy's first [zero (0)] output file will have the same data as the output file you had selected on the original when you saved the copy, but not the time.
For example, if on your original simulation you save a copy 5 seconds into the simulation and particles were just coming onto the receiving belt, the copy will look just like that 5 second file but the time will be reset to zero (0). This means that you will be unable to review prior to that point within the copy. If you need to see what was happening prior to the point at which you saved the copy, you will have to go to the original simulation to view the original output files.
See Also:
When you select 1-Way LBM or a User Process from the Data panel, the 3D View will show a colored box around the selection, as follows:
A white box indicates that an entity is both visible and is currently selected. To remove the white box from being shown in the 3D View, just select another entity from the Data panel.
A blue box represents the boundaries of the User Process domain and will persist as long as the entity is selected - even if the entity is hidden. Like the white box, the blue box will also be removed from being shown in the 3D View when you select another entity from the Data panel.
A green box represents the boundaries of the 1-Way LBM domain. As long as the entity it represents is visible (either through the Visible checkbox on the Coloring tab or through the Data panel Eye icons), and not currently selected, the green box will be shown in the 3D View. The only way to remove the green box from the 3D View is to disable or make hidden the entity it represents.
See Also:
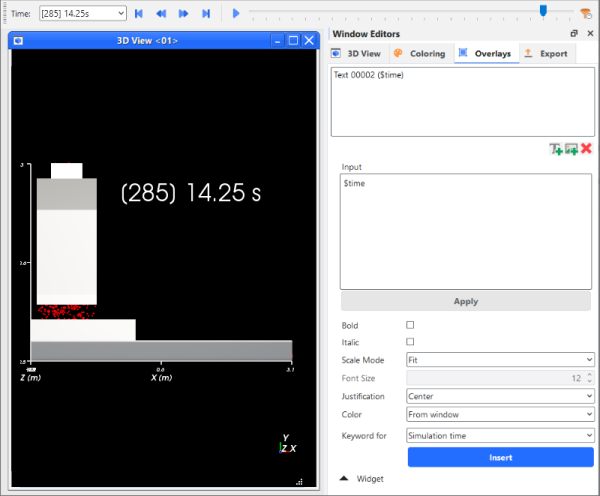
By default, no text overlays are shown on your 3D View windows. If you want to display the current timestep on a 3D View window, you must add a new text overlay, and then insert Simulation time as the keyword you want to display (Figure 1).
See Also:
By default, only the Rocky logo appears on your 3D View windows. If you want to add an additional logo, you may do so by adding an image overlay, and then changing the size and position of the overlay as you wish.
See Also:
When you maximize a 3D View, Plot, or Histogram window, the Minimize, Restore Down, and Close buttons are located directly beneath the main program buttons (Figure 1).

In this version of Rocky, there are many ways that power information can be collected, calculated, and analyzed-in both Properties and Curves.
Please refer to the Rocky Technical DEM Manual for details on the different ways power can be calculated. (From the Help menu, point to Manuals, and then click DEM Technical Manual.)
Tip: From within the PDF, you can use your viewer's Search or Find functionality to find the topics you are looking for.
See Also:
Enable and View Power Draw Data
By default, when you select Particles from the Data panel, any information you view on the Properties tab applies to all Particle sets you have created. If you are interested in seeing Property information for only one of your Particle sets, you must first create a Property User Process, and then use that process to filter by Particle Group. By viewing the Properties for the resulting User Process, you are able to see only the information for the particle group you selected.
From the Data panel, right-click Particles, point to Processes, and then choose Property. A new Property entry appears under User Processes in the Data panel.
From the Data Editors panel, select the Property tab.
From the Property list, select Particle Group.
Do one of the following:
To select a single particle group, from the Type list, select Value and then in the Cut value box, enter the number corresponding to the particle group you want.
To select a range of particle groups, from the Type list, select Range and then enter what you want in the Minimum value and Maximum value boxes.
Tips:
Particle group values are given in the order by which you have added particle groups, starting with zero. To determine what number to enter, show Particle Groups for the Particles entity in a 3D View window, and use the information on the legend provided. (See also I do not understand how my Particle set names map to the Particle Group value numbers.)
To revert values back to the default settings, which uses the Property limits to calculate middle-range values, click the Reset button.
See Also:
A single particle set includes the shape type, size distribution, and breakage parameters. In this version of Rocky, a particle set is equal to a Particle Group.
The easiest way to determine how the numbers assigned to the particle groups map to the Particle sets you have defined is to view the Particle Groups Property in a 3D View window, and then use the information provided on the legend to determine the mapping.
From the Data panel, select Particles.
From the Data Editors panel, select the Properties tab.
Under Name, locate Particle Group and then click-and-drag it to an empty location on the workspace. A new 3D View window will appear with the Particle set data and legend information in the V - Name format where V is the particle set value Rocky assigned and Name is the name of the Particle set used. Note: If you have set multiple release points for a single Particle set, then you will see multiple values of the same Name. For this reason, filtering by Particle Group may not be as useful for simulations involving multiple inlets that are releasing the same Particle set.
See Also:
Both the Particle Name and Particle Input properties for Particles (see also About Properties) were removed as of the v4.2 release of Rocky.
You should be able to get the same information by using the Particle Boundary properties instead.
See Also:
As of Rocky v4.5.0, one Solver Curve was removed from the product that was called "CFD Computation Fraction". (See also About Curves.)
To review changes from prior versions of Rocky, review the sections below.
As of Rocky v4.4.0, some existing Properties and Curves for Geometries were combined into new Properties and Curves, some were renamed, and some were removed. Use this topic to find the data that you are seeking.
(See also Add and Edit Geometry Components.)
Combined Geometry Properties The following two Properties were combined into a single new property called "Intensity : Dissipation":
Intensity : Dissipation : Normal
Intensity : Dissipation : Tangential Note: In versions prior to v4.3.0, this property was known as "Instantaneous Shear Power".
Combined Geometry Curves The following two Curves were combined into a single new Curve called "Power : Dissipation":
Power : Dissipation : Normal
Power : Dissipation : Tangential Note: In versions prior to v4.3.0, this curve was known as "Shear Intensity".
(See also About Adding and Editing Particle Sets.)
Combined Particle Set Properties (Per Set Only)
The following two Properties were combined into a single new Property called "Intensity : Dissipation":
Intensity : Dissipation : Normal Note: In versions prior to v4.3.0, this property was known as "Intensity Normal".
Intensity : Dissipation : Tangential Note: In versions prior to v4.3.0, this property was known as "Intensity Tangential".
The following two Properties were combined into a single new Property called "Power : Dissipation":
Power : Dissipation : Normal (now known only as "Power : Dissipation")
Power : Dissipation : Tangential (now known only as "Power : Dissipation")
Combined Particle Curves The following two Curves were combined into a single new Curve called "Energy : Dissipation":
Energy : Dissipation : Normal
Energy : Dissipation : Tangential
Renamed Particle Curves The Curves that were renamed include the following:
Specific Power (Normal) (now known as "Cumulative Specific Power : Impact")
Specific Power (Shear) (now known as "Cumulative Specific Power : Shear")
Power (Normal) (now known as "Power : Impact")
Power (Tangential) (now known as "Power : Shear")
Collision Rate (Normal) (now known as "Rate : Impact")
Collision Rate (Tangential) (now known as "Rate : Shear")
As of Rocky v4.3.0, some existing Properties and Curves for Geometries, Motion Frames, Particles, and Intra-Particle Collision Statistics were renamed and some were removed. Use this topic to find the data that you are seeking.
(See also Add and Edit Geometry Components.)
Renamed Geometry Properties The Properties that were renamed include the following:
Area (now known as "Area : Cell")
Nodal Area (now known as "Area : Nodal")
Nodal X-Coordinate (now known as "Coordinate : Nodal : X")
Nodal Y-Coordinate (now known as "Coordinate : Nodal : Y")
Nodal Z-Coordinate (now known as "Coordinate : Nodal : Z")
Displacement X (now known as "Displacement : X")
Displacement Y (now known as "Displacement : Y")
Displacement Z (now known as "Displacement : Z")
Instantaneous Impact Power (now known as "Intensity : Impact")
Instantaneous Shear Power (now known as "Intensity : Dissipation : Tangential")
Instantaneous Normal Stress (now know as "Stress : Normal")
Instantaneous Tangential Stress (now known as "Stress : Tangential")
Instantaneous Nodal Forces X (now known as "Force : Nodal : X")
Instantaneous Nodal Forces Y (now known as "Force : Nodal : Y")
Instantaneous Nodal Forces Z (now known as "Force : Nodal : Z")
Removed Geometry Properties The Properties that were removed include the following:
Mean Impact Power
Mean Shear Power
Mean Normal Stress
Mean Tangential Stress
Average Nodal Forces X
Average Nodal Forces Y
Average Nodal Forces Z
Tip: Even though the above Properties are no longer directly computed in this version of Rocky, you may still use the Time Statistics feature to acquire this data if needed. (See also About Adding and Editing Time Statistics Properties.)
Removed Geometry Curves The Curves that were removed include the following:
Impact Intensity X Belt Width
Shear Intensity X Belt Width
Renamed Geometry Curves The Curves that were renamed include the following:
Impact Intensity (now known as "Power : Impact")
Shear Intensity (now known as "Power : Dissipation : Tangential")
X-Force (now known as "Force : X")
Y-Force (now known as "Force : Y")
Z-Force (now known as "Force : Z")
Normal Force (now known as "Force : Normal")
Rotational Velocity X (now known as "Velocity : Rotational : X")
Rotational Velocity Y (now known as "Velocity : Rotational : Y")
Rotational Velocity Z (now known as "Velocity : Rotational : Z")
Translational Velocity X (now known as "Velocity : Translational : X")
Translational Velocity Y (now known as "Velocity : Translational : Y")
Translational Velocity Z (now known as "Velocity : Translational : Z")
(See also About Creating and Applying Motion Frames.)
Renamed Motion Frame Curves The Curves that were renamed include the following:
Rotational Velocity X (now known as "Angular Velocity X")
Rotational Velocity Y (now known as "Angular Velocity Y")
Rotational Velocity Z (now known as "Angular Velocity Z")
(See also About Adding and Editing Particle Sets.)
Removed Particles Properties (Simulation-Wide) The Properties that were removed include the following:
Maximum Normal Force Tip:You may get a more complete picture of this force by visualizing it from the Contacts entity. (See also About Contacts.)
Maximum Tangential Force Tip:You may get a more complete picture of this force by visualizing it from the Contacts entity. (See also About Contacts.)
Impact Specific Energy Tip:The Inter-particle Collision Statistics property called "Power : Impact" is nearly equivalent to this property. (See also About Inter-particle Collision Statistics.)
Shear Specific Energy Tip:The Inter-particle Collision Statistics property called "Power : Dissipation : Tangential" is nearly equivalent to this property. (See also About Inter-particle Collision Statistics.)
(See also About Intra-Particle Collision Statistics.)
Note: This feature was known as Particle Collision Statistics in prior versions of Rocky. (See also I cannot find Particle Collision Statistics.)
Renamed Particle Set Properties (Per Set Only) The Properties that were renamed include the following:
Nodal Area (now known as "Area : Nodal")
Duration Mean (now known as "Duration : Mean")
Duration Skewness (now known as "Duration : Skewness")
Duration Std. Dev. (now known as "Duration : Std. Dev.")
Intensity Normal (now known as "Intensity : Dissipation : Normal")
Intensity Tangential (now known as "Intensity : Dissipation : Tangential")
Stress Normal (now known as "Stress : Normal")
Stress Tangential (now known as "Stress : Tangential")
Velocity Normal Kurtosis (now known as "Velocity : Impact : Normal : Kurtosis")
Velocity Normal Mean (now known as "Velocity : Impact : Normal : Mean")
Velocity Normal Skewness (now known as "Velocity : Impact : Normal : Skewness")
Velocity Normal Std. Dev.(now known as "Velocity : Impact : Normal : Std. Dev.")
Velocity Tangential Kurtosis (now known as "Velocity : Impact : Tangential : Kurtosis")
Velocity Tangential Mean (now known as "Velocity : Impact : Tangential : Mean")
Velocity Tangential Skewness (now known as "Velocity : Impact : Tangential : Skewness")
Velocity Tangential Std. Dev.(now known as "Velocity : Impact : Tangential : Std. Dev.")
See Also:
Occasionally, the objects you want to display in a 3D View window will be larger than the camera's current field of view. In these cases, geometries and/or particles can appear to be omitted from the 3D view when rotating the image (Figure 1).
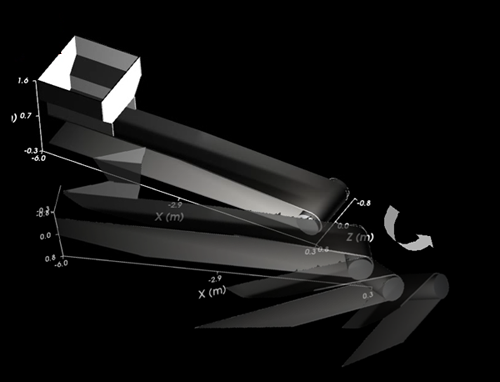
If this happens, reset the camera's field of view by doing one of the following:
Press the R key on your keyboard to Fit the active components into view
Select a Camera Preset from the Fit list
Close the current 3D View window and open a new one
See Also:
Most times, you can drag and drop a property from the Properties tab of an entity onto a 3D View, Particles Details, or Plot window, and it will display the data you selected. There are some exceptions, however, depending upon the type of property and/or type of window you use. See below for the most common exceptions.
Most properties in Rocky, such as mass or volume, are scalar quantities. This means they have a single value per particle (or per boundary triangle) and as such, can be displayed in a 3D View or be plotted.
A few properties in Rocky, such as Moment of Inertia and Stress Tensor (for Particles) are tensor quantities, which means that each value per particle (or per boundary triangle) is made up of nine separate components.
You can plot the components of the Stress Tensor in the Eulerian Statistics User Process (see also About Eulerian Statistics), or you can export the components of a tensor quantity using scripts (see also About Creating and Using PrePost Scripts), but you cannot show each component in a 3D View or even plot them within Rocky.
There are also a few vector properties, such as Translational Velocity (Particles) or Velocity (Fluids), which are made up of the x, y, and z directional components of the value. While the individual components of a vector property can be plotted or shown in a 3D View window, the vector property itself is limited to the 3D View only and cannot be plotted.
In Rocky, Space Plots are unique in that they require the data shown to be one-dimensional. Most Properties and Curves used in Rocky do not meet this criteria, so most of this data cannot be plotted in a Space Plot. There are a few specific conditions where Space Plots can still be useful for DEM analysis. (See also About Space Plots.)
See Also:
This version of Rocky makes use of the Python 3 programming language. This means that scripts that worked in prior versions of Rocky, and which used an older version of Python (specifically, Python 2.7), may no longer work in this version.
To resolve this issue, try one or more of the following:
Recreate your script using the latest version of Rocky. (See also Record a New Script.)
Edit your script in a Python editor and ensure that it meets the Python 3 criteria. (See also Edit a Saved Script Using the Python Programming Language.)
See Also:
In previous versions of Rocky, a script that was recorded and played in the Rocky UI was known as a macro.
Similar to scripts recorded and played in the PrePost Script panel today, these were PY files saved with a particular prefix; in this case, macro_.
In this version of Rocky, the macro concept has been replaced with the PrePost Script concept, but the underlying PY files are basically the same.
This means that if you have an older PY file saved with the macro_ prefix, it can still be shown and played in the PrePost Script panel, just as a PY file saved with the script_ prefix can be.
See Also:
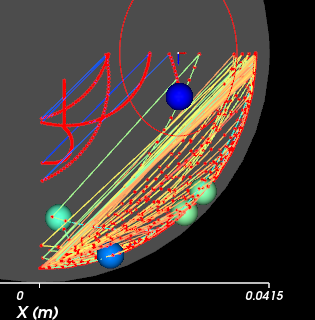
When using a Cylindrical Periodic Domain (see also About Domain Settings Parameters) and a Particles Trajectory User Process (see also About the Particles Trajectory User Process), you might notice that the trajectory lines include particles that cross the periodic domain. This can generate results with additional (incorrect) trajectory lines (Figure 1).
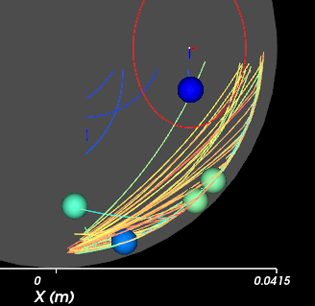
To avoid these errors, create a Cube or Cylinder User Process on your Particles Trajectory User Process, and make the dimensions a bit smaller than the dimensions of the Cylindrical Periodic Domain. This will serve to filter out the (incorrect) lines that are generated by the particles crossing the domain (Figure 2).
Figure 8.33: Cube User Processes added over the Particles Trajectory serves to filter out the incorrect lines
See Also:
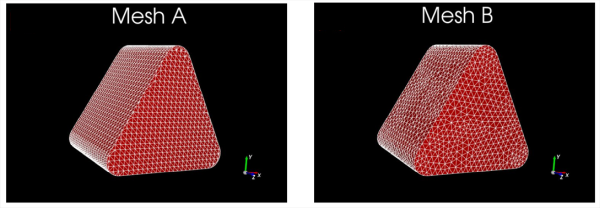
When you have chosen to collect Intra-particle Collisions Statistics (see also About Intra-Particle Collision Statistics) and are seeing very different Frequency values for similar particle shapes, this is likely due to the way the similar particle shapes are meshed, and in particular, how finely any large flat areas of the particle are meshed.
If the similar particle shapes are meshed in different ways, as shown in Figure 1, you might get slightly different results due to the way that Rocky categorizes and treats the geometries as convex and concave shapes respectively. (See also About Defining and Importing Custom Particle Shapes.)
However, if the similar particles also include large flat portions discretized with a large number of triangles, larger discrepancies in Frequency values might be seen in the following circumstances:
The overlaps are large (e.g., in the order of the triangles size).
Side-to-side collisions are frequent.
Discrepancies in Frequency arise in these cases because for a concave particle shape, a collision on the flat side will involve all the triangles that make up the flat side; for a convex particle, a collision on the flat side will likely involve only one triangle.
Refer to the DEM Technical Manual for more information. (From the Rocky Help menu, point to Manuals, and then click DEM Technical Manual.)
See Also:
In versions of Rocky prior to 2022 R1, after processing your 2-Way Fluent coupling cases there were made available the following vector and associated directional components to the implicit source term property:
Solid Implicit Force
Solid Implicit Force X
Solid Implicit Force Y
Solid Implicit Force Z
Because the directional components were all the same value, and did not contain any directional information, the vector and associated directional components were replaced by a single property called Solid Implicit Force in 2022 R1, which better reflected the data while reducing the overall storage requirements.
See Also: