


During the course of a simulation, you may want to monitor, print, write, and/or plot solution data; this is done using report definitions. A report definition is an object that specifies a certain quantity or set of values to be computed at the end of a solver timestep or iteration. You can then choose to have multiple report definitions printed to the console, written to a single file, or plotted in the same window.
You can use report definitions to monitor convergence, verify mesh independence, and record time-histories. These report definitions can monitor the value of field variables or functions through specified operations, such as surface, volume, force, moment, and flux integrals.
Once you create report definitions, they can be added to a report file. Report files can include multiple report definitions of varied types. Multiple report definitions can be plotted in the same graphics window by adding them to a single report plot. One report definition can be included in multiple report plots and files. For additional information on report files and plots, see Report Files and Report Plots.
Important: Expression report definitions created prior to release 2019 R3 appear as Custom Report Definitions in this release and Fluent may be unable to evaluate them. You can recreate any affected report definitions using the Expression Report Definition dialog box and they should evaluate correctly.
You can create report definitions from multiple locations in Fluent, allowing you to quickly define report definitions, regardless of where you are in your workflow. The primary method to create a report definition is through the ribbon. For example:
![]() Solution → Reports
→ Definitions → New
→ Surface Report → Area-Weighted
Average...
Solution → Reports
→ Definitions → New
→ Surface Report → Area-Weighted
Average...
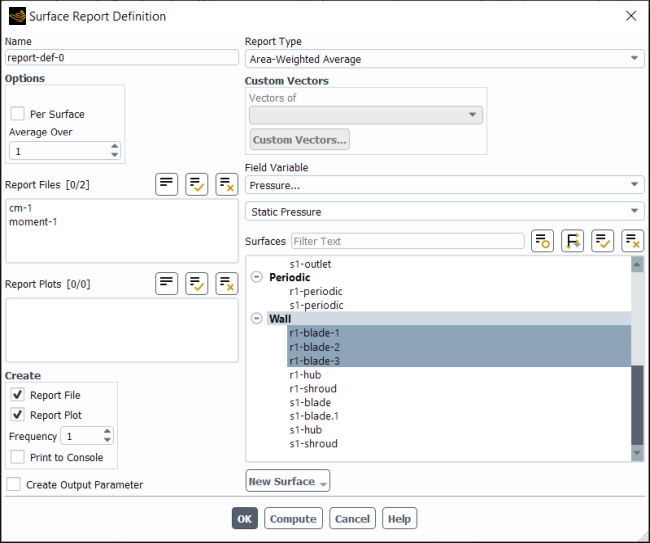
Opens the Surface Report Definition dialog box.
Alternative methods for accessing this dialog box are:
through the tree, by right-clicking the Report Definition branch
through the graphics window via the right-click context menu (when the mesh is displayed and one or more surfaces or volumes are selected)
through the New drop-down list in the Figure 41.1: Report Definitions Dialog Box
Many of the setup steps are the same or similar when setting up the various types of report definitions.
To set up the Surface Report Definition dialog box:
Enter a name for the report definition under Name.
If you want the value reported on individual surfaces rather than the net results from a group of surfaces, enable the Per Surface option.
Important: The Per Surface and Per Zone options are incompatible with an Average Over value greater than
1. The issue is that the net value does not reflect the specified Average Over value. The net value is seen when you click , use the report definition in an expression, or as an output parameter.If you intend to use an Average Over of
2or more, then create separate report definitions for each surface or zone.(optional) To have Fluent calculate a running average for the Surface Report Definition you can enter a positive integer greater than 1 (the default) for Average Over.
Specifying a number greater than 1 means that Fluent will print, plot, and write the running average value of the selected variable instead of the current value of the same variable.
The value reported is averaged over the last
 iterations/time steps, where
  is your specified Average Over value. When the
iteration/time step number is lower than
is your specified Average Over value. When the
iteration/time step number is lower than  , Fluent calculates the average of the available variable
values.
, Fluent calculates the average of the available variable
values.Important: Increasing the Average Over value exposes an additional Retain Instantaneous Values option. When enabled, the option ensures that the report file storing the data for this report definition will not only store the averaged values, but the instantaneous values as well. This preserves the flexibility to change the Average Over value, because Fluent will have the data require to re-compute a new average.
If you plan on varying the Average Over value at any point in the future, it is recommended that you start with an Average Over of at least 2, so that Write Instantaneous Values is enabled in the containing report file (assuming you keep Retain Instantaneous Values enabled when you create the report definition).
Fluent automatically creates a report file and plot for each report definition (indicated by Report File and Report Plot being enabled within the Create group box).
If you prefer to write all your report definitions to a single file, you can select an existing file from the Report Files list.
The default behavior of automatically enabling Report File and Report Plot for new report definitions is controlled in Preferences by the Automatically Plot and File option (File>Preferences...>SimulationReport Definitions>Automatically Plot and File).
If you want the report definition available as an output parameter, enable Create Output Parameter.
Note: Using the Per Surface or Per Zone option with multiple selected surfaces/zones in conjunction with the Create Output Parameter option, results in a single output parameter. The output parameter will show a single combined value for all the selected surfaces/zones.
Choose the surface report definition integration method by selecting Area, Integral, Standard Deviation, Flow Rate, Mass Flow Rate, Volume Flow Rate, Area-Weighted Average, Mass-Weighted Average, Sum, Uniformity Index - Mass Weighted, Uniformity Index - Area Weighted, Facet Average, Facet Minimum, Facet Maximum, Vertex Average, Vertex Minimum, Vertex Maximum, Custom Vector Based Flux, Custom Vector Flux, or Custom Vector Weighted Average from the Report Type drop-down list. These methods are described in Surface Integration.
If you selected Custom Vector Based Flux, Custom Vector Flux, or Custom Vector Weighted Average from the Report Type drop-down list, you must define the vectors in the Custom Vectors group box.
Unless you are reporting a mass flow rate or volume flow rate, specify the variable or function to be integrated in the Field Variable drop-down list. First select the desired category in the upper drop-down list. You can then select one of the related quantities in the lower list. (See Field Function Definitions for an explanation of the variables in the list.) If you are running a multiphase simulation you may need to select the phase of interest (or mixture) from the Phase drop-down list (depending on the field variable selected).
Note:In general, you can select any arbitrary field variable for each report type. However, not all possible combinations are physically meaningful.
For multiphase flow, you should use only the Mass Flow Rate integral to compute the mass flow rate of the mixture or for an individual phase. Do not use the Flow Rate integral of the Volume Fraction field variable as this will result in erroneous results.
Select the Surfaces where you want Fluent to evaluate the specified variable.
Click to create the report definition and close the dialog box.
Once you have created a report definition, it appears in the Figure 41.1: Report Definitions Dialog Box.
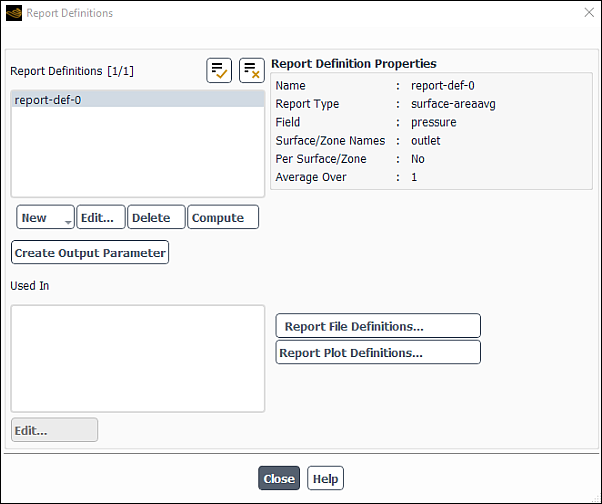
You can use this dialog box to review and modify the properties of the existing report definitions.
Note: The report definitions that are automatically created for transient simulations (flow-time, delta-time, iters-per-timestep) are not available for export or copying.
The following sections detail setup instructions that are specific to each type of report definition.
- 41.2.1.1. Surface Report Definitions
- 41.2.1.2. Volume Report Definitions
- 41.2.1.3. Force and Moment Report Definitions
- 41.2.1.4. Flux Report Definition
- 41.2.1.5. Mesh Report Definitions
- 41.2.1.6. Aerodamping (Travelling Wave Method) Report Definition
- 41.2.1.7. DPM Report Definition
- 41.2.1.8. User Defined Report Definition
- 41.2.1.9. Expression Report Definition
You can use the Figure 41.2: Surface Report Definition Dialog Box to create surface report definitions. There are many different types of surface-based report definitions that you can create, including:
Integral
Standard Deviation
Flow Rate
Mass Flow Rate (non-field based)
Volume Flow Rate (non-field based)
Area-Weighted Average
Mass-Weighted Average
Sum
Uniformity Index — Mass Weighted
Uniformity Index — Area Weighted
Facet Average
Facet Minimum
Facet Maximum
Custom Vector Based Flux (custom-vector based)
Custom Vector Flux (custom-vector based, non-field based)
Custom Vector Weighted Average (custom-vector based)
To plot or write the surface report definition data you must use a Report File or Report Plot. If a surface report definition is already included in a report file/plot, then that report file/plot will be highlighted. If you de-select a report file/plot that had included the current report definition and click , the report definition will be removed from that report file/plot. For additional information on report files and plots, see Report Files and Report Plots.
![]() Solution → Reports
→ Definitions → New
→ Surface Report
Solution → Reports
→ Definitions → New
→ Surface Report
The procedure for creating surface report definitions is covered in Creating Report Definitions.
You can use the Figure 41.3: Volume Report Definition Dialog Box to create volume report definitions. There are many different types of volume reports that you can create, including:
Volume (non-field based)
Sum
Sum*
 (only axi-symmetric)
Max
Min
Volume Integral
Volume Average
Mass Integral
Mass Average
Mass (non-field based)
![]() Solution → Reports
→ Definitions → New
→ Volume Report
Solution → Reports
→ Definitions → New
→ Volume Report
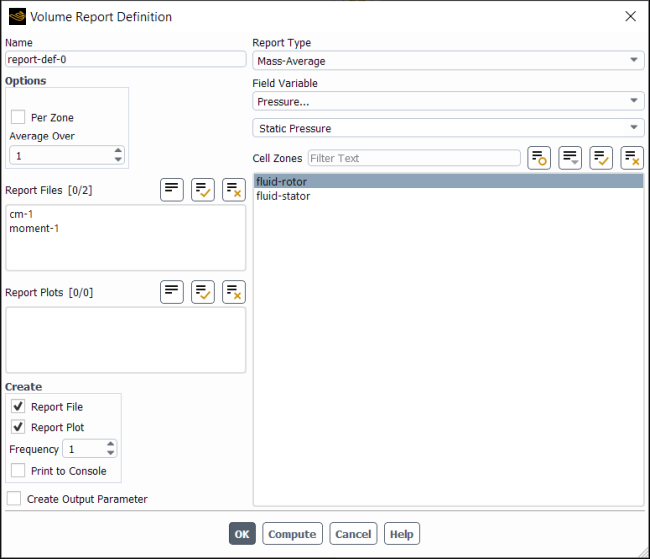
The common steps for creating a volume report definition are covered in Creating Report Definitions, and the volume report definition-specific steps are as follows:
If you want the value reported on individual wall zones rather than the net results from a group of wall zones, enable the Per Zone option.
Choose the integration method for the volume report definition by selecting Volume, Sum, Sum*2Pi (2D axisymmetric cases only), Max, Min, Volume Integral, Volume-Average, Mass Integral, Mass-Average, or Mass in the Report Type drop-down list. These methods are described in Volume Integration.
Specify the variable or function to be integrated in the Field Variable drop-down list. First select the desired category in the upper drop-down list. You can then select one of the related quantities in the lower list. (See Field Function Definitions for an explanation of the variables in the list.)
Select the Cell Zones where you want Fluent to evaluate the specified variable. The Cell Zones list will show any defined expression volumes, as they are also valid inputs for volume-based computations.
Note: While cell registers may appear in the cell zone lists, they cannot be used in volume report definitions.
Click to create the report definition and close the dialog box.
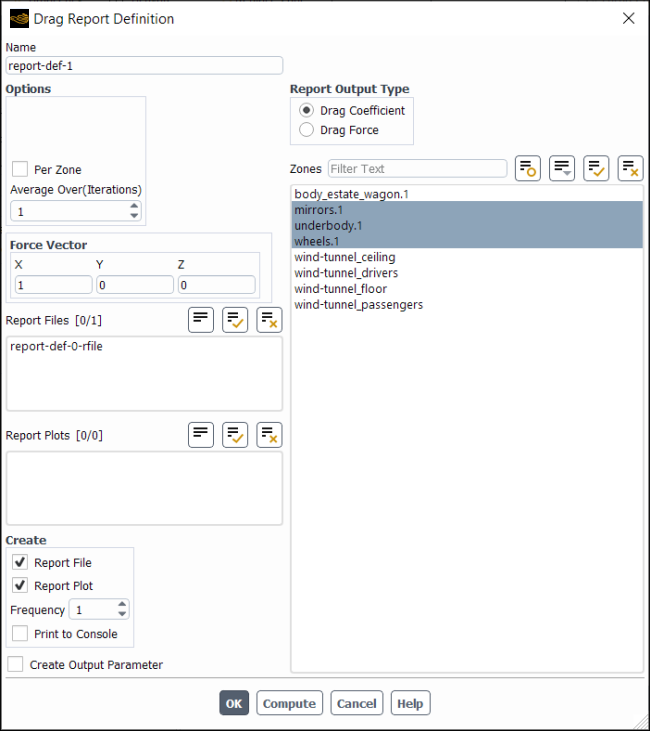
Monitoring force coefficients can be useful when you are calculating external aerodynamics, for example, and are especially interested in the lift coefficient. By monitoring these values you may also be able to stop the calculation early and reduce the processing time, as sometimes the force and moment coefficients converge before the residuals have decreased three orders of magnitude. (In such an instance, you should be sure to check the mass flow rate and heat transfer rate as well, to ensure that the mass and energy are being suitably conserved. This is accomplished using either the Figure 41.5: Drag Report Definition Dialog Box, the Figure 41.6: Lift Report Definition Dialog Box, the Figure 41.7: Moment Report Definition Dialog Box, or the Figure 41.4: Force Report Definition Dialog Box).
To begin setting up force or moment report definitions, first enter appropriate values in the Reference Values task page, as described in Reference Values. The relevant values include the following:
The force coefficients use the reference area, density, and velocity.
The moment coefficients use the reference area, density, velocity and length.
For information about how these coefficients are calculated, see Computing Forces, Moments, and the Center of Pressure in the Fluent Theory Guide.
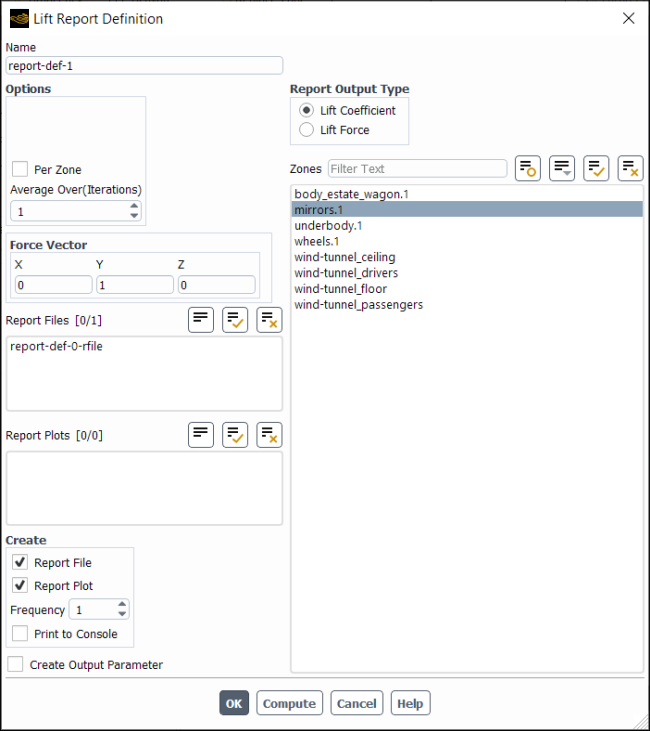
Tip: You can have Fluent report unscaled force values by selecting Drag Force or Lift Force in the Report Output Type group box of the Drag Report Definition or Lift Report Definition dialog boxes, respectively.
Next, open the appropriate dialog box through the Solution tab of the ribbon.
![]() Solution → Reports
→ Definitions → New
→ Force Report
Solution → Reports
→ Definitions → New
→ Force Report
Select either Drag..., Lift..., Moment..., or Force... to open the Figure 41.5: Drag Report Definition Dialog Box, Figure 41.6: Lift Report Definition Dialog Box, Figure 41.7: Moment Report Definition Dialog Box, and Figure 41.4: Force Report Definition Dialog Box. Note that you can only access one of these report definition dialog boxes at a time, though multiple report definitions of the same type can be used during the simulation.
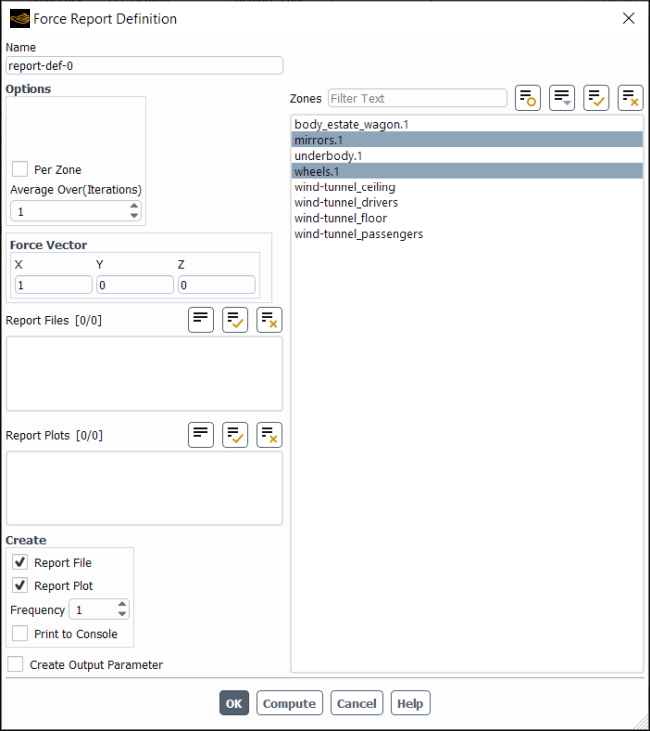
The common steps for creating a force or moment report definition are covered in Creating Report Definitions, and the force/moment report definition-specific steps are as follows:
If you want to report the force or moment coefficient data from individual wall zones rather than the net results from a group of wall zones, enable the Per Zone option.
Depending on the coefficient that will be monitored, perform one of the following steps:
In the Drag Report Definition, Lift Report Definition or Force Report Definition dialog box, enter the X, Y, and Z components of the Force Vector along which the forces will be computed. By default, the Force Vector for the drag coefficient is a unit vector in the
 direction, whereas for the lift coefficient it is a unit vector
in the
direction, whereas for the lift coefficient it is a unit vector
in the  direction.
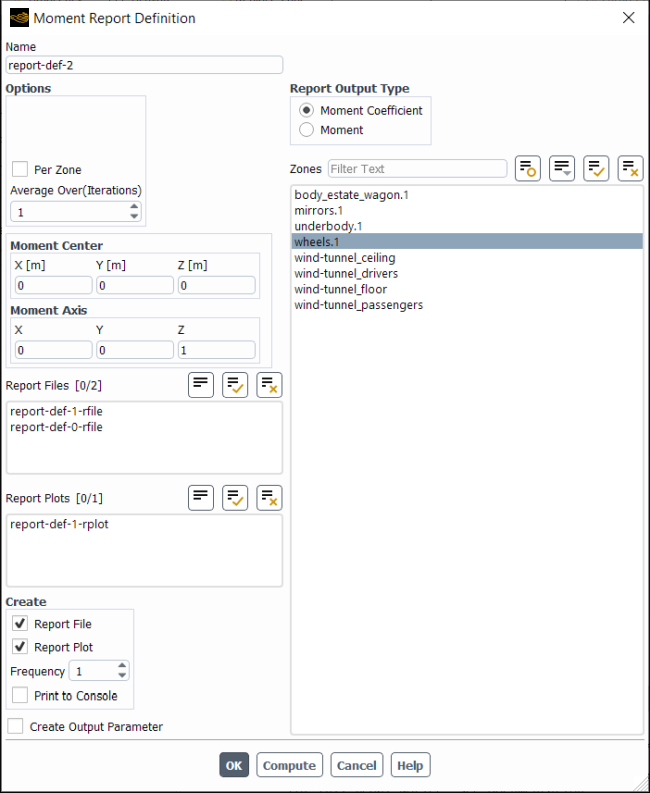
In the Moment Report Definition dialog box, enter the Cartesian coordinates (X, Y, and Z) of the Moment Center, about which moments will be computed. The default Moment Center is (0, 0, 0). You also need to enter the X, Y, and Z components for the Moment Axis, along which the moment coefficient will be calculated. By default, the Moment Axis is defined as a unit vector in the
 direction.
Select the appropriate zone(s) for computation of the force/moment/coefficient(s).
Click to save the report definition settings.
If you need to revise the settings of a particular report definition after they have been saved, double-click the report definition in the tree.
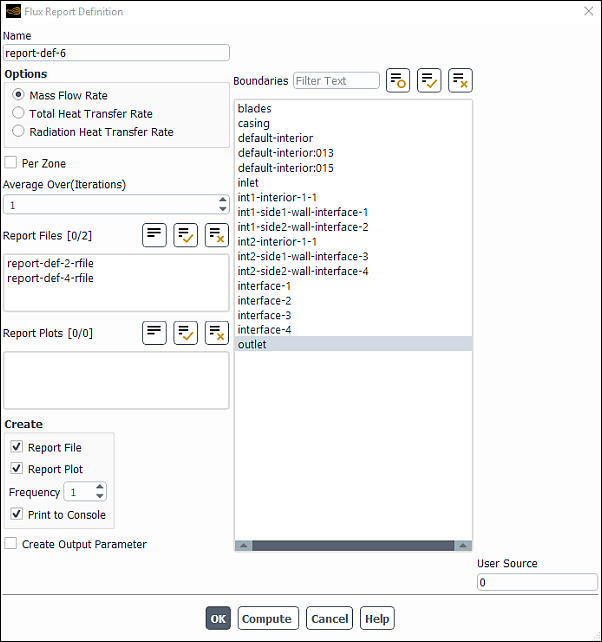
You can use the Figure 41.8: Flux Report Definition Dialog Box to create flux report definitions. There are many different types of flux-based report definitions that you can create, including:
Mass Flow Rate
Total Heat Transfer Rate
Total Sensible Heat Transfer Rate
Radiation Heat Transfer Rate
Pressure Work Rate
Viscous Work Rate
Film Mass Flow Rate
Film Heat Transfer Rate
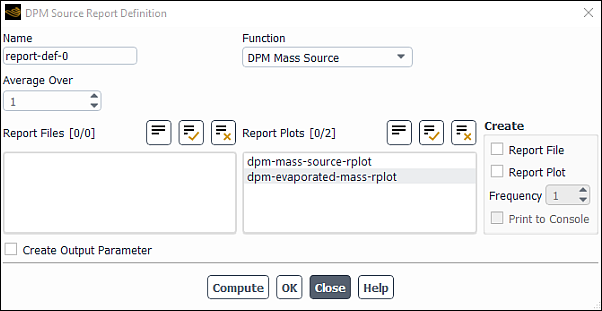
DPM Mass Source
DPM Enthalpy Source
DPM Sensible Enthalpy Source
![]() Solution → Reports
→ Definitions → New
→ Flux Report
Solution → Reports
→ Definitions → New
→ Flux Report
The common steps for creating a flux report definition are covered in Creating Report Definitions, and the flux report definition-specific steps are as follows:
Select or confirm the type of flux report.
Note: If you are reporting Mass Flow Rate on any interior zones, you must enable Per Zone to see the mass flow rate value, otherwise it is reported as
0.Fluent reports the mass flow rate at individual interior zones as
0because there are instances where such non-zero computations would be illogical. For example, if you have a continuous fluid volume containing 10 interior zones, and you report the true mass flow rate through the domain at each interior zone, a summation of the mass flow rate at each interior zone would result in a mass flow rate that is 10 times higher than reality.Select the appropriate boundaries for the flux calculations.
Note: Fluxes can only be computed on boundaries and not on user defined surfaces such as planes, points, iso-surfaces, and so on.
Click to save the report definition settings.
If you need to revise the settings of a particular report definition after they have been saved, double-click the report definition in the tree.
Note: If you enable Create Output Parameter, the report definition will show the contributions of sources (when applicable) when the output parameter is printed to the Console.
For additional information on the available options for DPM source report definitions, see DPM Source Report Definition Dialog Box in the reference guide.
You can create mesh report definitions for the following:
cell count (that is, the number of cells within one or more cell zones)
face count (that is, the number of faces within one or more boundary zones)
Such reports can be useful for simulations that involve adaption, dynamic mesh remeshing, and so on.
You can open the appropriate dialog box through the Solution tab of the ribbon.
![]() Solution → Reports
→ Definitions → New
→ Mesh Report
Solution → Reports
→ Definitions → New
→ Mesh Report
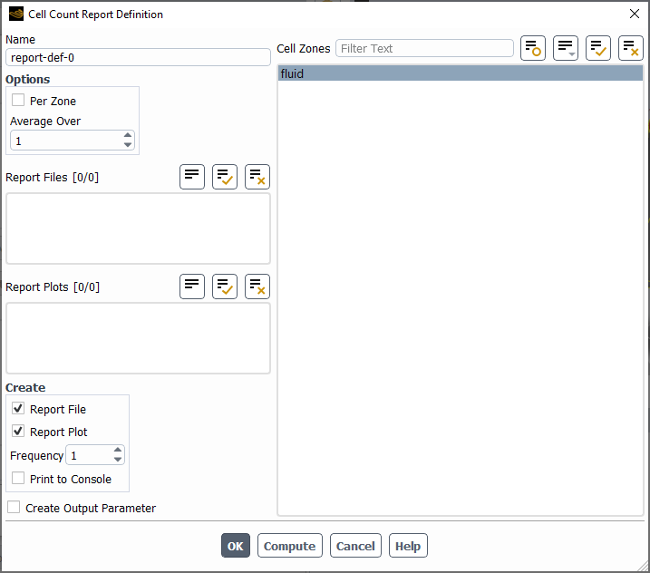
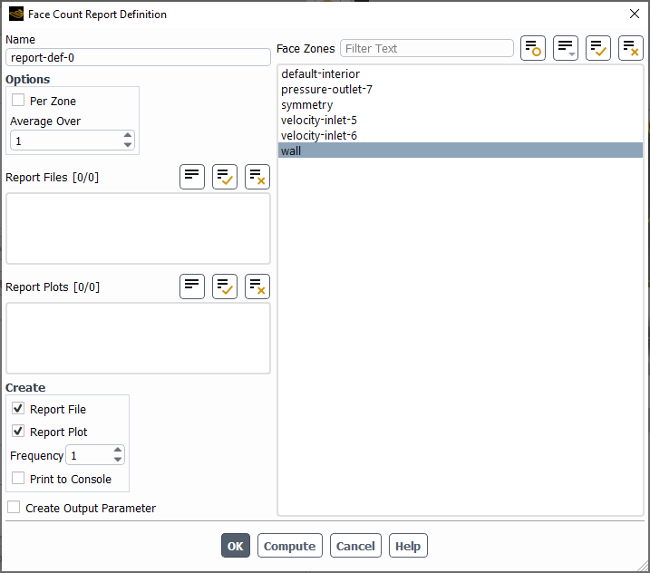
Select either Cell Count... or Face Count... to open the Figure 41.10: Cell Count Report Definition Dialog Box or Figure 41.11: Face Count Report Definition Dialog Box, respectively. Note that you can only access one of these report definition dialog boxes at a time, though multiple report definitions of both types can be used during the simulation.
The common steps for creating a mesh report definition are covered in Creating Report Definitions, and the mesh report definition-specific steps are as follows:
If you want to report the counts for individual zones rather than a net count from a group of zones, enable the Per Zone option.
Depending on what is being counted, perform one of the following steps:
In the Cell Count Report Definition dialog box, select the Cell Zones for which you want Fluent to report the number of cells.
In the Face Count Report Definition dialog box, select the Face Zones for which you want Fluent to report the number of faces.
Click to create the report definition and close the dialog box.
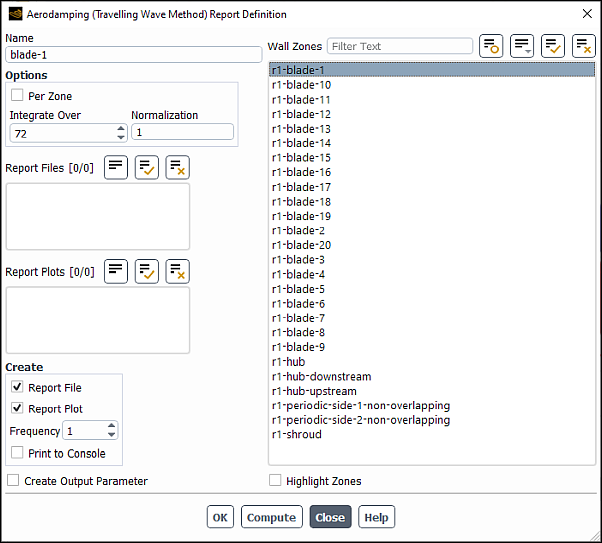
You can use the Figure 41.12: Aerodamping (Travelling Wave Method) Report Definition Dialog Box to create aerodamping report definitions.
![]() Solution
→ Reports → Definitions
→ New → Aeromechanics
Report → Aerodamping (Travelling Wave
Method)...
Solution
→ Reports → Definitions
→ New → Aeromechanics
Report → Aerodamping (Travelling Wave
Method)...
The common steps for creating an Aerodamping (Travelling Wave Method) report definition are covered in Creating Report Definitions, and the Aerodamping (Travelling Wave Method) report definition-specific steps are as follows:
If you are modeling multiple (main) blades, select Per Zone so that the damping value is calculated for each dynamic mesh zone (which encompasses one main blade and possibly accompanying splitter blades).
Set Integrate Over to the number of time steps over which to integrate when calculating the damping value; a suggested value is the number of time steps per period.
The number of time steps per period is shown in the Run Calculation task page.
For additional information on aerodamping, see Aerodynamic Damping (Blade Flutter Analysis).
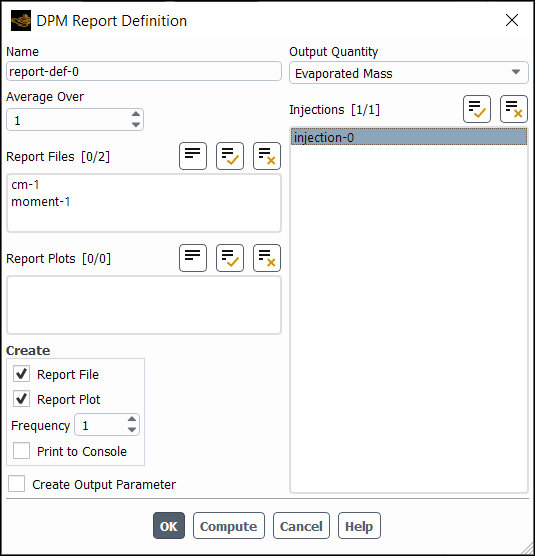
You can use the DPM Report Definition dialog box to create DPM report definitions. The following types of DPM reports are available:
Injected Mass (unsteady particle tracking only): Reports the total DPM mass injected into the domain.
Mass in Domain (unsteady particle tracking only): Reports the total DPM mass present in the domain.
Mass in Fluid (unsteady particle tracking only): Reports all DPM mass currently residing as free-stream particles in the domain. This option is available only with the wall-film DPM boundary condition.
Mass in Film (unsteady particle tracking only): Reports all DPM mass currently residing in Lagrangian wall-film. This option is available only with the wall-film DPM boundary condition.
Escaped Mass: Reports the DPM mass that has left the domain through a certain boundary or boundaries.
Evaporated Mass: Reports the total evaporated DPM mass for the selected injection(s). The quantity accounts for fully evaporated particles as well as all mass that has evaporated from any other particles. For unsteady tracking, this includes particles that are still present in the domain.
Penetration Length (unsteady particle tracking only): Reports the total penetration length in meters.
![]() Solution → Reports
→ Definitions → New
→ DPM Report
Solution → Reports
→ Definitions → New
→ DPM Report
The common steps for creating a DPM report definition are covered in Creating Report Definitions, and the DPM report definition-specific steps are as follows:
Select or confirm the type of DPM report.
For the report, if you want to have the escaped mass calculated per injection, enable the text command
report/dpm-zone-summaries-per-injection.The Injections selection list will then appear in the DPM Report Definition dialog box.
From the Injections list, select the appropriate injections for the DPM report.
Note: For the report, this step is relevant only if you have enabled the calculation of the escaped mass per injection.
For the report, select the boundary(s) where the injected particles exit the domain from the Boundaries selection list.
For the Penetration Length report, you can specify the Particles Mass Fraction. You can also enable User-Specified Origin and Direction to specify those coordinates.
For unsteady particle tracking, you can select Show Mass Flow/Change Rate (default) for the Injected Mass, Mass in Domain, Mass in Fluid, Mass in Film, , and Evaporated Mass reports if you want to create a report for the mass flow rate rather than the total mass.
Click to save the report definition settings.
If you need to revise the settings of a particular report definition after they have been saved, double-click the report definition in the tree.
Important: For unsteady particle tracking, if you want to select one or more injection(s) for any report, you must enable the report/dpm-zone-summaries-per-injection text command before the first particles are injected; otherwise, some of the reported values may become inconsistent.
For additional information on the available options, see the DPM Report Definition Dialog Box in the reference guide.
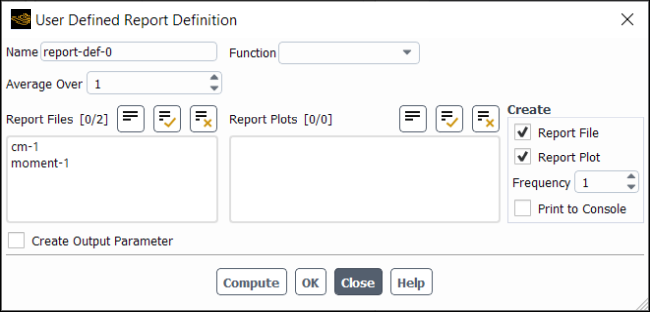
User defined report definitions allow you to create functions that return values that can be plotted, printed, written, or used in other expressions. User defined report definitions can also be used in the Convergence Conditions (Convergence Conditions).
Creating a user defined report definition is a two step process:
Create a user defined report definition function.
Hook the user defined report definition function to the user defined report definition.
User defined report definition functions are defined with the
DEFINE_REPORT_DEFINITION_FN macro, which takes the function name as
the argument. The function must return a real value. Once written, it should be compiled and
loaded the same way as other user-defined functions, see Interpreting and Compiling UDFs in the Fluent Customization Manual for more information.
The function body should be constructed similarly to any C function that returns a real value. Any valid C code can be included in the function body.
DEFINE_REPORT_DEFINITION_FN can use all of the APIs available
for other user-defined functions, including:
Last evaluated values of all report definitions.
Current values of all input parameters that have been set to be used inside user-defined functions.
See
DEFINE_REPORT_DEFINITION_FN
in the Fluent Customization Manual for information on writing user defined report definition
functions.
With the user defined report definition function written, you must hook this function to the user defined report definition.
The common steps for creating a user defined report definition are covered in Creating Report Definitions, and the user defined report definition-specific steps are as follows:
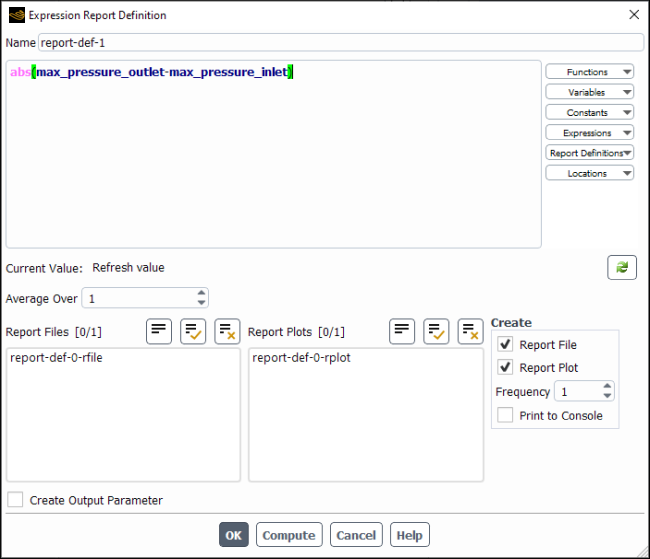
You can create expressions from report definitions, allowing you to combine report definitions with mathematical operators to create a new report definition that can be written or plotted. For example, you can create a pressure-drop report for the difference in area-weighted pressures between an inlet and an outlet. You can also use an expression report definition to modify a single report definition with expression functions such as a mathematical function or reduction operation.
![]() Solution → Reports
→ Definitions → New
→ Expression
Solution → Reports
→ Definitions → New
→ Expression
The common steps for creating an expression report definition are covered in Creating Report Definitions, and the expression report definition-specific steps are as follows:
Create the Report Definition(s) that you will use to create an Expression.
Use the drop-downs to the right of the Definition box to select the report definition(s) and other variables and functions, as required to define your desired expression report definition. You can also directly enter the expression into the Definition box—the drop-downs are available to make the process easier.
Note: When you use curly brackets "{}" to specify the name of a defined object, such as a report definition or a cell register, automatic suggestions are disabled and you must provide the display name of that object.
Click to create the expression report definition.
Refer to Fluent Expressions Language for additional information on creating expressions.
Report Files and Report Plots are collections of report definitions that are written to a single file (report file) or plotted to a graphics window (report plot) at specified intervals. In steady-state cases, report files are evaluated at the specified iteration, whereas in transient cases you have the option to specify the evaluation frequency based on iterations or timesteps.
Report definitions in the same Report Plot must have the same units.
Report Files Format:
"<report-file-name>"
"Iteration"|"Timestep" "<first-report-def-name> etc.."
("Iteration"|"Timestep" "<report-def-1-name>" "<report-def-2-name>"...)
<Iteration/Timestep> <report-def-1-value> <report-def-2-value>...
Report definitions included in a report plot are plotted in the specified window at the specified frequency. It is possible to plot the same report in multiple windows. Both report plots and report files provide the option to print to the console. You can deactivate the writing and plotting of individual report files and plots for a particular calculation; deactivated report files and plots can be re-activated at a later time.
Important: You can control whether Report Plot and Report File are enabled by default for new report definitions by using the Automatically Plot and File option under Report Definitions in the Simulation branch of Preferences (File>Preferences...).
In order to create a report file you must have first created a report definition.
![]() Solution → Monitors
→ Report
Files
Solution → Monitors
→ Report
Files![]() New...
New...
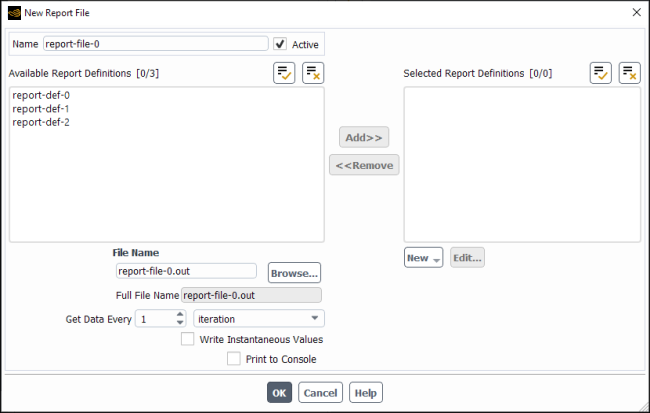
Provide a name for how you want this report file to appear in the Fluent tree.
You have the option to deactivate the writing of this report file by de-selecting the Active check box to the right of the Name.
Select one or more report definitions from Available Report Definitions and click , to specify the reports you want written to the same file.
Provide an appropriate name in the File Name text box. The Full File Name that appears below the File Name field is created with a run index and iteration/time step index, appended to the base name. It also provides the full path to the file. You can use the keyboard arrow keys to scroll within this field (<, >).
Specify the frequency at which you want the report definitions written to the file.
Note: In a transient simulation, if you specify an Average Over value in a report definition, you must set Get Data Every to time-step or flow-time. If you set Get Data Every to iteration, Fluent will use the instantaneous value of the report definition.
(Optional) Enable the Write Instantaneous Values option to retain the flexibility of changing the Average Over value of a report definition in a future session (otherwise, Fluent would not have the data necessary to re-compute the average over values). See Moving Average Monitors for additional information.
Click to save the new report file.
You have the option to view—and edit —properties of report files that you created previously by selecting Edit... when you right-click Report Files in the tree, which opens the Figure 41.17: Report File Definitions Dialog Box.
Note that you can also right-click an individual report definition to modify it directly.
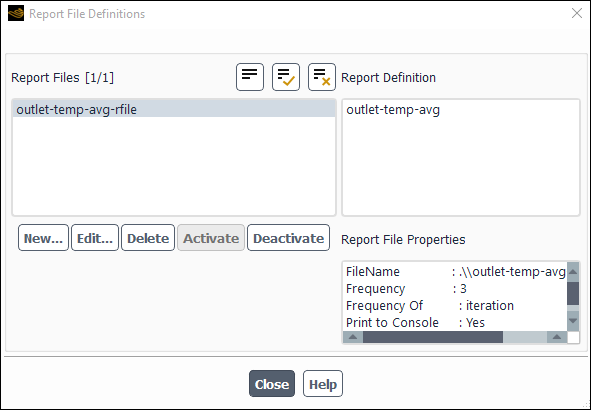
Selecting a report file to modify opens the Figure 41.18: Edit Report File Dialog Box.
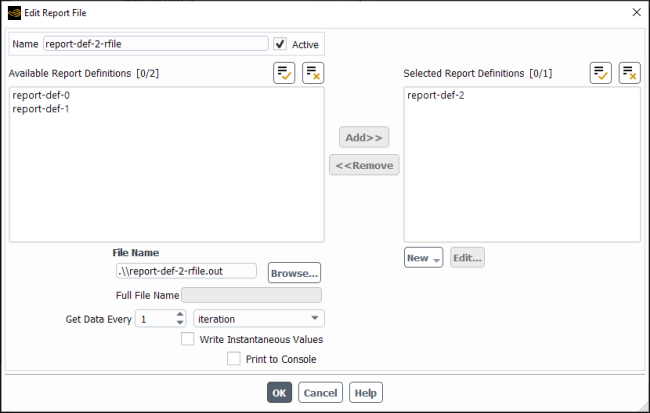
In order to create a report plot you must have first created a report definition.
![]() Solution → Monitors
→ Report
Plots
Solution → Monitors
→ Report
Plots![]() New...
New...
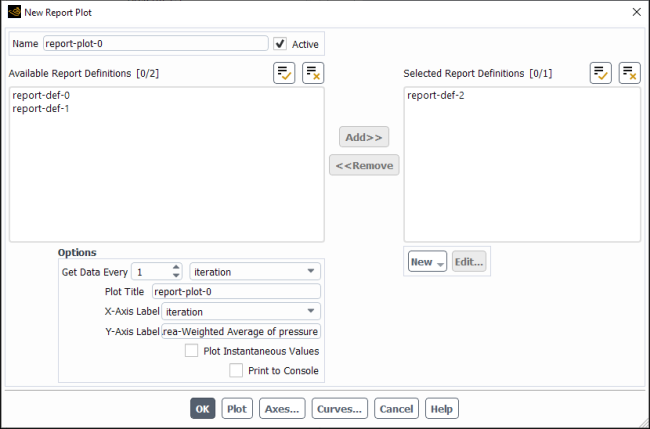
Provide a name for how you want this report plot to appear in the Fluent tree.
You have the option to deactivate the plotting of this report plot by de-selecting the Active check box to the right of the Name.
Select one or more report definitions from Available Report Definitions and click , to specify the reports you want plotted in the same window.
Provide an appropriate names in the Plot Title and Y-Axis Label group boxes.
Specify the frequency at which you want the report definitions plotted.
Note: In a transient simulation, if you specify an Average Over value in a report definition, you must set Get Data Every to time-step or flow-time. If you set Get Data Every to iteration, Fluent will use the instantaneous value of the report definition.
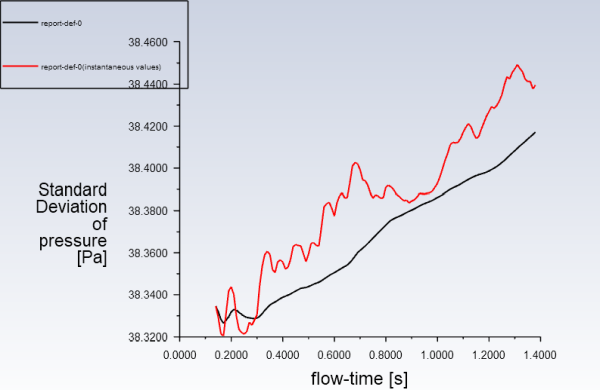
(Optional) Enable the Plot Instantaneous Values option to include the instantaneous values of the report definition along with the averaged values (averaged based on the Average Over value specified in the included report definition).
Click to save the new report plot.
Note: By Default, Fluent only displays 1000 plot points when a report plot generated in a previous Fluent session is plotted in a new Fluent session. However, you can increase this limit in Preferences. Specify the desired maximum number of plot points in the Report Plot Data History Size field in the Simulation branch of Preferences (File>Preferences...>Simulation>Report Definitions>Report Plot Data History Size).
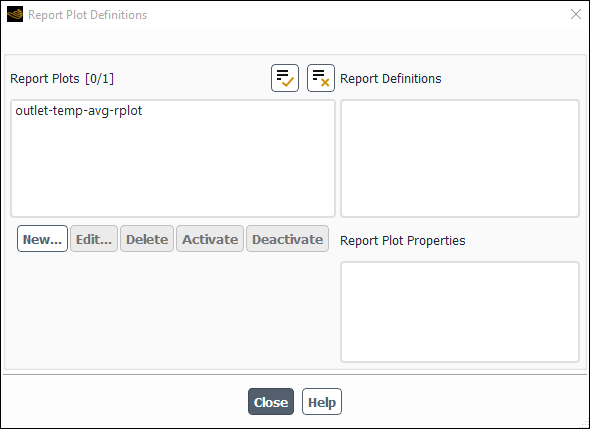
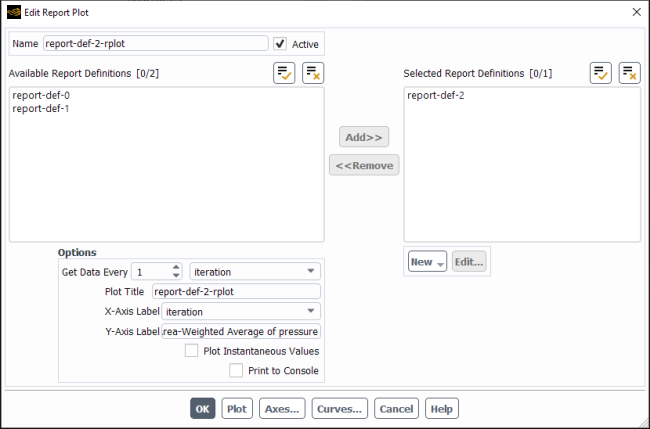
You have the option to edit report plots that you created previously by selecting Edit... when you right-click Report Plots in the tree, which opens the Figure 41.20: Report Plot Definitions Dialog Box.
Once you begin iterating, Fluent displays report plots in the graphics window. If you close the graphics window containing a plot, you can redisplay it by right-clicking the report plot in the Outline View tree and selecting Plot.
Selecting a report plot to modify opens the Figure 41.21: Edit Report Plot Dialog Box.
You can vary the number of timesteps or iterations included in the averaging computations for report definitions. Changing the averaging interval can help you smooth fluctuations in an observed quantity or let you see fluctuations that were previously smoothed out.
To control the averaging interval and maintain the ability to do so in a new session:
Create a report definition.
 Solution → Report
Definitions
Solution → Report
Definitions  New
→ <Report Category>
→ <Report Type>
New
→ <Report Category>
→ <Report Type>Specify interval used for averaging in the Average Over (Timesteps | Iterations) field. The default value of
1means that you always have the instantaneous value, however, if you plan on modifying the Average Over value later, it is recommended that you begin with an Average Over of at least 2 when you create the report definition. This ensures that its containing report file will have the Write Instantaneous Values option enabled, (assuming you leave Retain Instantaneous Values enabled after increasing the Average Over value).Important: When you increase the reporting interval to a value greater than 1, the Retain Instantaneous Results check box appears. You must leave this option checked if you want the flexibility to change the averaging interval in a future session.
Confirm Report Plot and Report File are enabled in the Create group box. Alternatively, you can include the report definition in an existing report file or relevant report plot.
Important: You can control whether Report Plot and Report File are enabled by default using the Automatically Plot and File option under Report Definitions in the Simulation branch of Preferences (File>Preferences...).
Click .
Once you create your report definitions for monitoring the solution progress, you can change the reporting interval by re-opening the report definition dialog box, modifying the Average Over (Timesteps | Iterations) field, and clicking . The updated averaging interval will be used when you re-plot the report definition using its associated report plot.
In addition to the ability vary the averaging interval, you can also plot the instantaneous values with the averaged values, as shown in Figure 41.22: Plot with Instantaneous and Averaged Values.
To include the instantaneous values with the average:
Open the Report Plot dialog box that includes the quantity of interest (by default, it will have the same name as the corresponding report definition).
Solution → Monitors
→ Report Plot
→ <report-plot-name> Edit...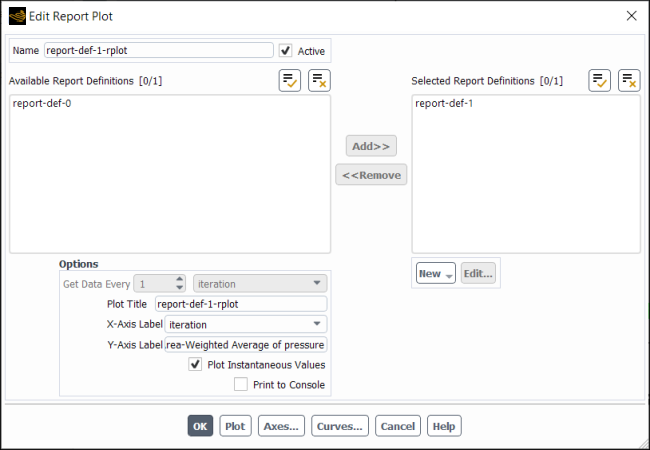
Enable Plot Instantaneous Values.
Click .
To ensure that you can include instantaneous values in plots for these data when this case is opened in a new session:
Open the Report File that includes the quantity of interest.
Solution → Monitors
→ Report File
→ <report-file-name> Edit...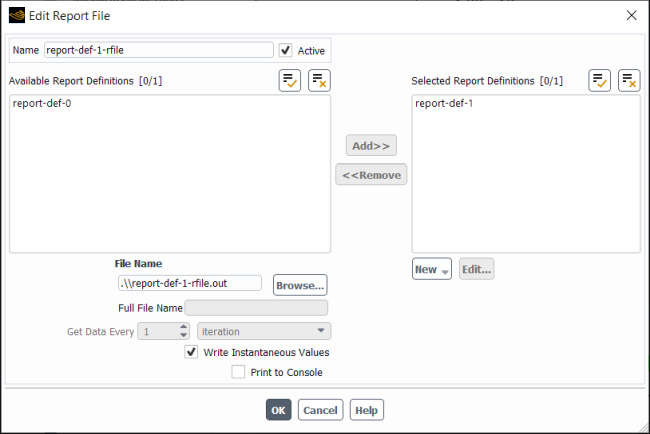
Enable Write Instantaneous Values.
Click .
In certain situations you may want to clear the history of report files or plots, without deleting the objects or creating new plots or files for the same quantities.
![]() Solution → Monitors
→ Report Files
→ <report-file-name>
Solution → Monitors
→ Report Files
→ <report-file-name>![]() Clear
Data
Clear
Data
![]() Solution → Monitors
→ Report Plots
→ <report-plot-name>
Solution → Monitors
→ Report Plots
→ <report-plot-name>![]() Clear
Data
Clear
Data
You can do this by right-clicking the report file or plot that you want to clear and selecting Clear Data. For report files, this option deletes the file from the system. A new report file of the same name will be created once you begin iterating. For report plots, this option clears the data from the system memory, so the plot will be empty until you begin iterating again.