


This section describes how to compute surface integrals. For mathematical definitions of the various integral types, refer to Computing Surface Integrals in the Theory Guide.
For additional information, see the following section:
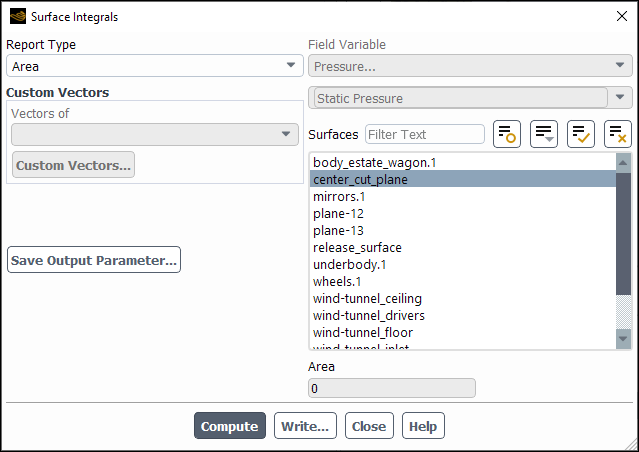
To obtain a report for selected surfaces of the area, custom vector-based flux, custom vector flux, custom vector-weighted average, mass flow rate, or volume flow rate, or the integral, flow rate, standard deviation, sum, facet maximum, facet minimum, uniformity index (weighted by mass or area), vertex maximum, vertex minimum, or mass-, area-, facet-, or vertex-averaged quantity of a specified field variable, use the Surface Integrals Dialog Box (Figure 41.32: The Surface Integrals Dialog Box).
![]() Results → Reports → Surface Integrals
Results → Reports → Surface Integrals ![]() Edit...
Edit...
The steps for generating the report are as follows:
Specify which type of report you are interested in by selecting Area, Area-Weighted Average, Custom Vector Based Flux, Custom Vector Flux, Custom Vector Weighted Average, Facet Average, Facet Minimum, Facet Maximum, Flow Rate, Integral, Mass Flow Rate, Mass-Weighted Average, Standard Deviation, Sum, Uniformity Index - Mass Weighted, Uniformity Index - Area Weighted, Vertex Average, Vertex Minimum, Vertex Maximum, or Volume Flow Rate in the Report Type drop-down list.
If you selected Custom Vector Based Flux, Custom Vector Flux, or Custom Vector Weighted Average from the Report Type drop-down list, you must define vectors in the Custom Vectors group box.
If you are performing a multiphase simulation, you may need to select the phase of interest from the Phase drop-down list depending on the selected Report Type.
If you are generating a report of area, mass flow rate, or volume flow rate, skip to the next step. Otherwise, use the Field Variable drop-down lists to select the field variable to be used in the surface integrations. First, select the desired category in the upper drop-down list. You can then select a related quantity from the lower list. (See Field Function Definitions for an explanation of the variables in the list.)
In the Surfaces list, choose the surface(s) on which to perform the surface integration.
To create an output parameter for the reported value, click Save Output Parameter.... The Save Output Parameter Dialog Box (Figure 41.24: The Save Output Parameter Dialog Box) will open where you will specify the name of the newly created output parameter, or overwrite an existing output parameter of the same type. Ansys Fluent automatically creates generic default names for new input and output parameters (for example, parameter-1, parameter-2, and so on).
After the output parameter is created, it is listed in the Parameters Dialog Box. You can create any number of output parameters of this report type.
Note: If you create an output parameter from a surface integral report and save the case and data (write), an equivalent report definition will be created when you read in the case file.
Click the Compute button. The computed results are printed in the numeric result field and also in the Ansys Fluent console.
The Net value reported in the Ansys Fluent console corresponds to the specified calculation performed over the list of selected surfaces.
To save the computed results to a file, click the Write... button and specify the filename in the resulting Select File dialog box.
Note the following:
Mass averaging “weights” toward regions of higher velocity (that is, regions where more mass crosses the surface).
Flow rates reported using the Surface Integrals Dialog Box are not as accurate as those reported with the Flux Reports Dialog Box (described in Fluxes Through Boundaries).
The facet and vertex average options are recommended for zero-area surfaces.
The uniformity index represents how a specified field variable varies over a surface, where a value of 1 indicates the highest uniformity. The uniformity index can be weighted by area or mass: the area-weighted uniformity index captures the variation of the quantity (for example, the species concentration), whereas the mass-weighted uniformity index captures the variation of the flux (for example, the species flux). See Computing Surface Integrals in the Theory Guide for the equations used to calculate the uniformity index.