


Just as you can create and customize simulation reports in Ansys Fluent (Using Simulation Reports), you can also generate separate design point reports, as well as reports for the parametric study itself.
To define specific settings that will be applied to your individual design point-specific report(s), in the Simulation Report Outline task page, select Design Point Settings for the Current Report. See Creating Design Point Reports for Your Simulation for more information.
To define specific settings that will be applied to a parametric report, in the Simulation Report Outline task page, select Parametric Report for the Current Report. See Creating Parametric Reports for Your Simulation for more information.
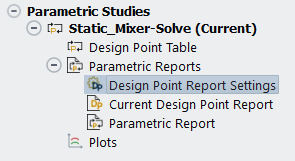
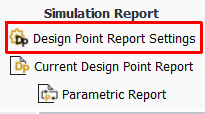
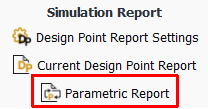
Parametric and design point reports can also be accessed by using the Simulation Report category of the Parametric Ribbon, or by the Parametric Reports node of the Parametric Study View in the Outline View.
You can create customized simulation reports for your design points in your parametric study. For instance, you can create one type of simulation report for your initial ("base") design point, and other, completely different, custom report settings for each individual design point.
Note: These settings are the same as a standard Ansys Fluent Simulation Report, and are described in Using Simulation Reports.
To gain access to the settings that can be applied to your design point report:
Double-click the Design Point Report Settings node in the Parametric Study View for your particular study.
Alternatively, click Base Design Point Report Settings in the Simulation Report category of the Parametric Ribbon
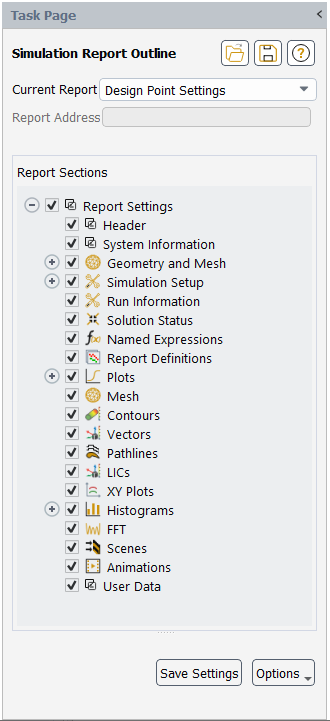
Either of these actions displays the Simulation Report Outline task page (with the Current Report set to Design Point Settings), where general settings can be made for the design point reports .
These setting categories are described in detail in Overview of Design Point Report Settings
When you are satisfied with your settings, click Save Settings to have these settings available for all of your design point reports. Use the Options button to restore default settings.
Note: For any report settings that you want to apply to a design point report, make sure that you save your design point report settings before updating the relevant design points.
You can control the visibility of design point report categories using the check boxes to include/exclude all or parts of the report. You can also control the arrangement of design point report categories by reorganizing elements of your report prior to generating it. To do so, drag and drop elements of the report section tree onto other portions of the tree to rearrange the order and contents of various sections of your simulation report. For more information, see Organizing Your Simulation Report.
Design point reports contain the following sections (with their own Descriptions field that you can provide):
Under Report Settings, there are several aspects of your design point report that you can control from a global perspective.
Layout Settings - choose whether the layout of your results plots (such as contours, vectors, etc.) will be included in your report as a series of tabs, or in tabular columns. These settings can be applied to all the graphics results images in your report. These settings can be applied to the report as a whole, or to individual graphical object categories. See Changing the Layout of Your Results for details.
Image Settings - choose the default view orientation and resolution for your included graphics results (such as saved views/states, or common orientations such as top, bottom, left, right, and so on). See Customizing Your Report Image Settings for details.
Header information includes fields for the Analyst name, and the Date (by default). Additionally, you can specify your Company name and your Logo image file. Further more, there are additional options for URL, Phone and Fax numbers, Address information, and a Description for the simulation.
System Information
Geometry and Mesh, including sections for Mesh Size, Mesh Quality, and Orthogonal Quality.
Simulation Setup (where you can opt to Show Only Modified Settings), including sections for Physics (that includes Models, Material Properties, Cell Zone Conditions, Boundary Conditions, and Reference Values) and Solver Settings.
Run Information includes an option to Include License Usage.
Solution Status
Named Expressions provides a means to customize the named expressions within your report. You can choose to include following details of your expressions: Definition, Value, Unit, Used In, and Description. All options are selected by default. Deselect those options that you do not want to include in your report.
Report Definitions
System Information
Any available graphics objects that you want to include in your report, such as Plots, Mesh, Contours, Vectors, Pathlines, LICs, XY Plots, Histograms, FFT, Scenes, Animations, or your own custom view(s).
For these objects, you can also provide Layout Settings, if desired, where you can choose whether the layout of your results plots (such as contours, vectors, etc.) will be included in your report as a series of tabs, or in tabular columns. These settings can be applied to all the graphics results images in your report. These settings can be applied to the report as a whole, or to individual graphical object categories. See Changing the Layout of Your Results for details.
Additionally, you can display the object using a particular orientation using the View field (front, back, left, bottom, isometric, etc.). Use the Preview View button to see what the image will look like once it is in the report. The isometric view is the default orientation.
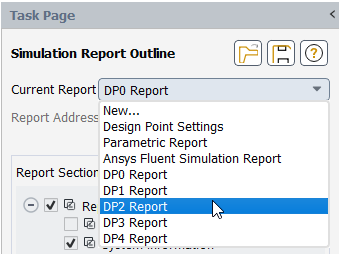
When saved, general design point report settings (described in Overview of Design Point Report Settings) are applied to all design points in the parametric study. When you update the design points in your parametric study, Fluent generates the individual reports for each design point. You can view and edit selected design point reports (and their settings) if you require additional customization. For a given parametric study's list of design points, you can access individual settings for each design point report in the Current Report drop-down list.
When you have configured your design point report settings to your satisfaction, generate a design point report using the Generate button at the bottom of the task page. See Generating Simulation Reports for more information.
Once the design point report is generated, it appears in its own tab alongside the graphics window. Alternatively, you can use the View button at the bottom of the task page. See Viewing Simulation Reports for more information.
Once generated, you can save your reports as PDF or standalone HTML using the Export button at the bottom of the task page. See Saving Simulation Reports for more information.
You can create customized simulation reports for your parametric study.
To gain access to the settings that can be applied to your parametric report:
Double-click the Parametric Report node in the Parametric Study View for your particular study.
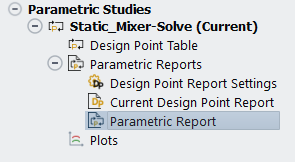
Alternatively, click Parametric Report in the Simulation Report category of the Parametric Ribbon
Either of these actions displays the Simulation Report Outline task page (with the Current Report set to Parametric Report), where general settings can be made for the parametric report .
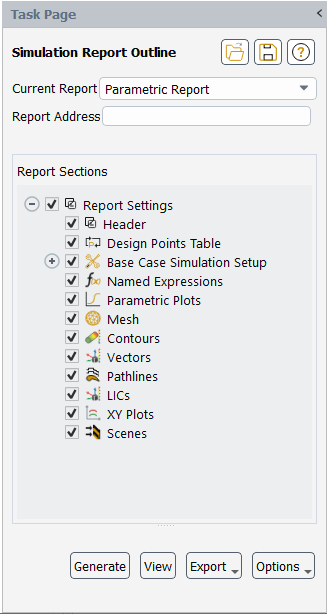
These setting categories are described in detail in Overview of Parametric Report Settings
You can control the visibility of report categories using the check boxes to include/exclude all or parts of the report. You can also control the arrangement of report categories by reorganizing elements of your report prior to generating it. To do so, drag and drop elements of the report section tree onto other portions of the tree to rearrange the order and contents of various sections of your simulation report. For more information, see Organizing Your Simulation Report.
Parametric reports contain the following sections (with their own Descriptions field that you can provide).
Under Report Settings, there are several other aspects of your parametric report that you can control from a global perspective.
Layout Settings - choose whether the layout of your results plots (such as contours, vectors, etc.) will be included in your report as a series of tabs, or in tabular columns. These settings can be applied to all the graphics results images in your report. These settings can be applied to the report as a whole, or to individual graphical object categories. See Changing the Layout of Your Results for details.
Image Slider View Settings - choose whether your results plots (such as contours, vectors, etc.) will include a standard slider, a comparison slider, or both. These settings can be applied to the report as a whole, or to individual graphical object categories. See Comparing Parametric Results for details.
Image Settings - choose the default view orientation and resolution for your included graphics results (such as saved views/states, or common orientations such as top, bottom, left, right, and so on). See Customizing Your Report Image Settings for details.
Theme Settings - choose the Use Dark Theme option to present your simulation report (and included plots) with a dark background and white text, with any graphics result images remaining as they were originally captured. The Use Dark Theme option will be enabled by default if you have chosen to run Ansys Fluent using the Dark theme preference (see Customizing the Graphical User Interface and Setting User Preferences/Options).
Other categories include:
Header information includes fields for the Analyst name, and the Date (by default). Additionally, you can specify your Company name and your Logo image file. Further more, there are additional options for URL, Phone and Fax numbers, Address information, and a Description for the simulation.
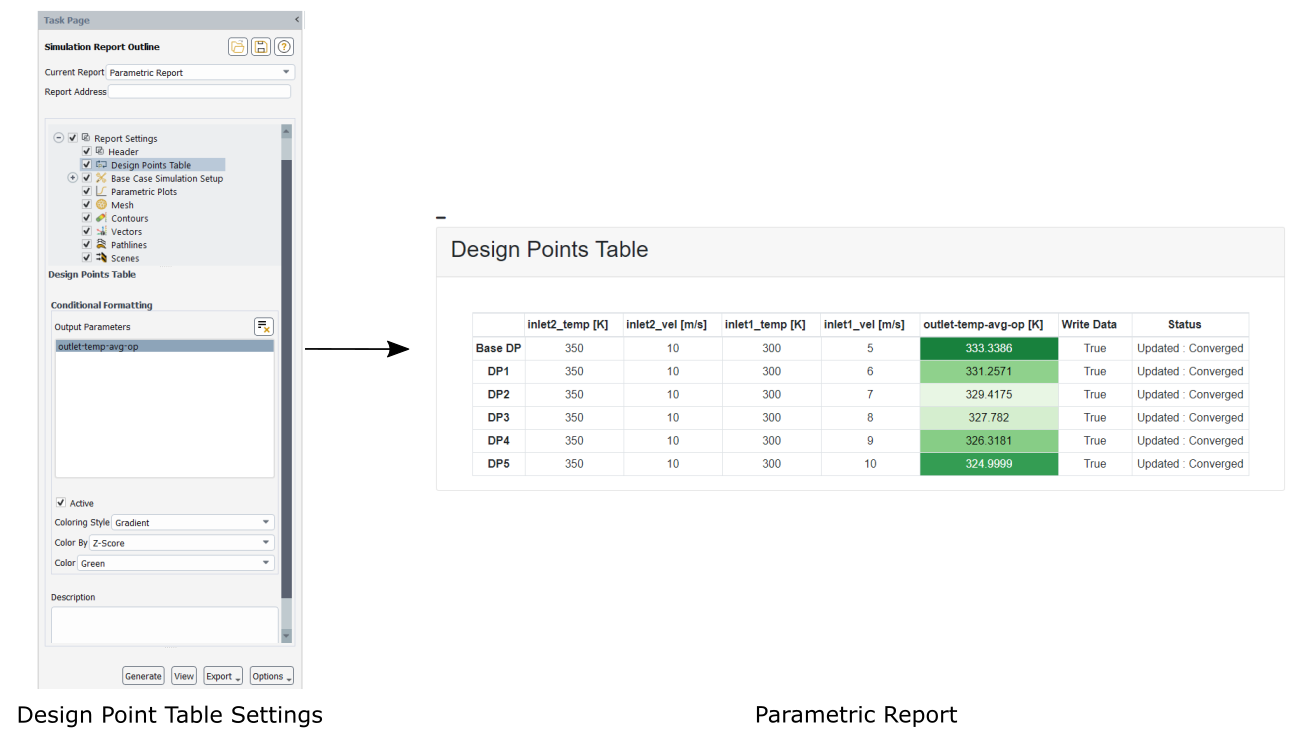
Design Point Table. Here you can choose Conditional Formatting options for your output parameters, customizing how they appear in the report's design point table.
The following options are available:
Use the Active check box to include or exclude the conditional coloring and styling settings in the report. When enabled, the conditional settings are applied to the design point table column, otherwise, when disabled, no conditional settings are applied to the table column.
Choose a Coloring Style (Solid or Gradient).
When the Coloring Style is set to Solid, you can then choose to Color By either Z-Score or Value Range.
When you specify Value Range, you can choose to apply colors to the table based on values that are Above a Minimum Value, values that are Below a Maximum Value, or to select Between a Minimum and a Maximum Value where you can specify a Minimum Value and Maximum Value.
When the Coloring Style is set to Gradient, you can choose to Color By either Z-Score or Magnitude
Choose the Color as either Red, Green, or Blue.
Base Case Simulation Setup, including the Solver Settings and Physics sections (which itself contains sections for Models, Material Properties, Cell Zone Conditions, and Boundary Conditions) and Reference Values
Parametric Plots. Here, you can also define Layout Settings where you can determine whether the layout of your results plots (such as contours, vectors, etc.) will be included in your report as a series of tabs, or in tabular columns. These settings can be applied to all the graphics results images in your report. These settings can be applied to the report as a whole, or to individual graphical object categories. See Changing the Layout of Your Results for details.
Any available graphics objects that you want to include in your report, such as Named Expressions, Mesh, Contours, Vectors, Pathlines, LICs, XY Plots, Scenes, or your own custom view(s). Additionally, you can display the object using a particular orientation using the View field (front, back, left, bottom, isometric, etc.). Use the Preview View button to see what the image will look like once it is in the report. The isometric view is the default orientation.
Note: For Named Expressions, you can use the Expression Details list to customize the named expressions within your report. You can choose to include the following details of your expressions: Definition, Unit, Used In, and Description. All options are selected by default. Deselect those options that you do not want to include in your report.
Note: The parametric report's table of named expressions does not include any named expressions that are used as input parameters. This is because the definition for these expressions originates from the input parameter value for the design point that is designated to be the current design point when you generate the parametric report. So, the definition appears static in the parametric report, when in reality it is not static but instead is based on the input parameter value for each design point. The input parameter values for each design point are still found in the design point table section of the report where the context is more sensible.
The individual design point report's table of named expressions, however, does include such input parameter named expressions. This is because the inclusion of the static expression definition makes more sense in the context of the single design point and case file.
As part of the Report Settings, under Image Slider View Settings, you can determine whether your results plots (such as contours, vectors, etc.) will include a standard slider, a comparison slider, or both.
Choosing the standard option provides a single tab where you can use a standard slider to view the results for one design point at a time. Choosing the comparison option provides a single tab where two results can be visualized side-by-side with their own sliders. Choosing the both option provides both a standard slider tab, and the comparison tab.
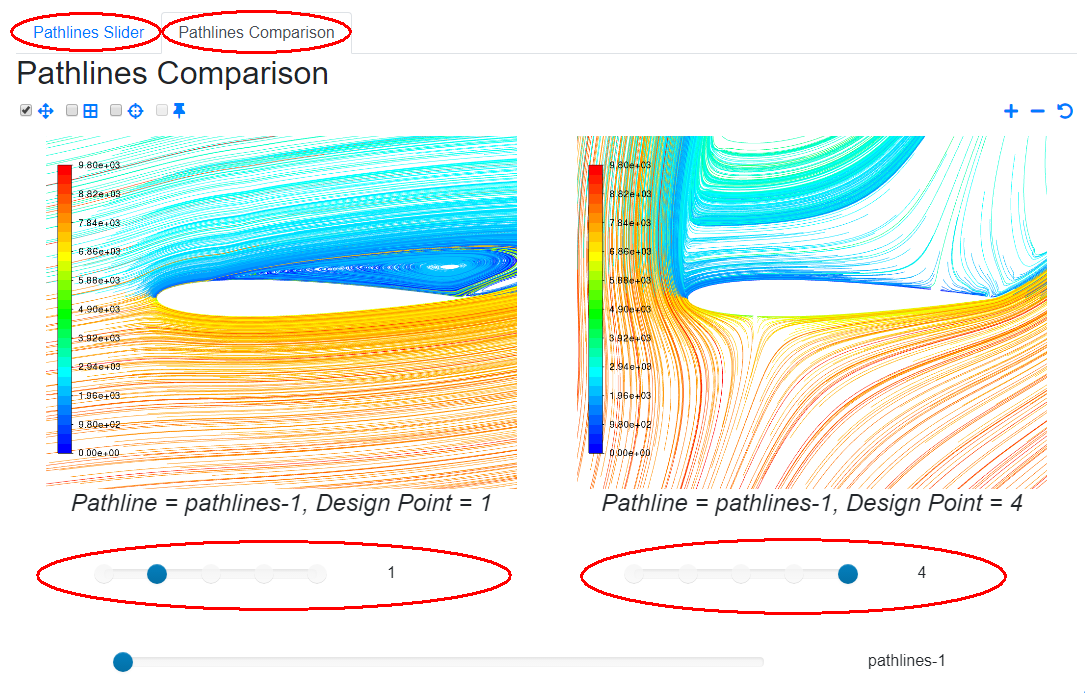
The comparison view contains useful tools to interactively analyze the details of your plots within your report.
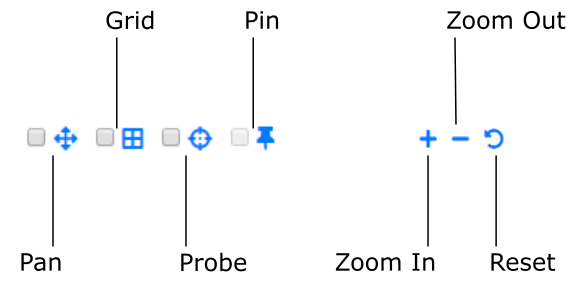
To enable the Pan, Probe, Grid, and Pin features, select the corresponding check box.
Note: You cannot use the Probe in conjunction with either the Pan or the Grid feature at the same time.
Pan lets you move the move around the displayed graphics, especially useful when you use the Zoom In and Zoom Out features.
Grid lets you add grid lines to the graphics display.
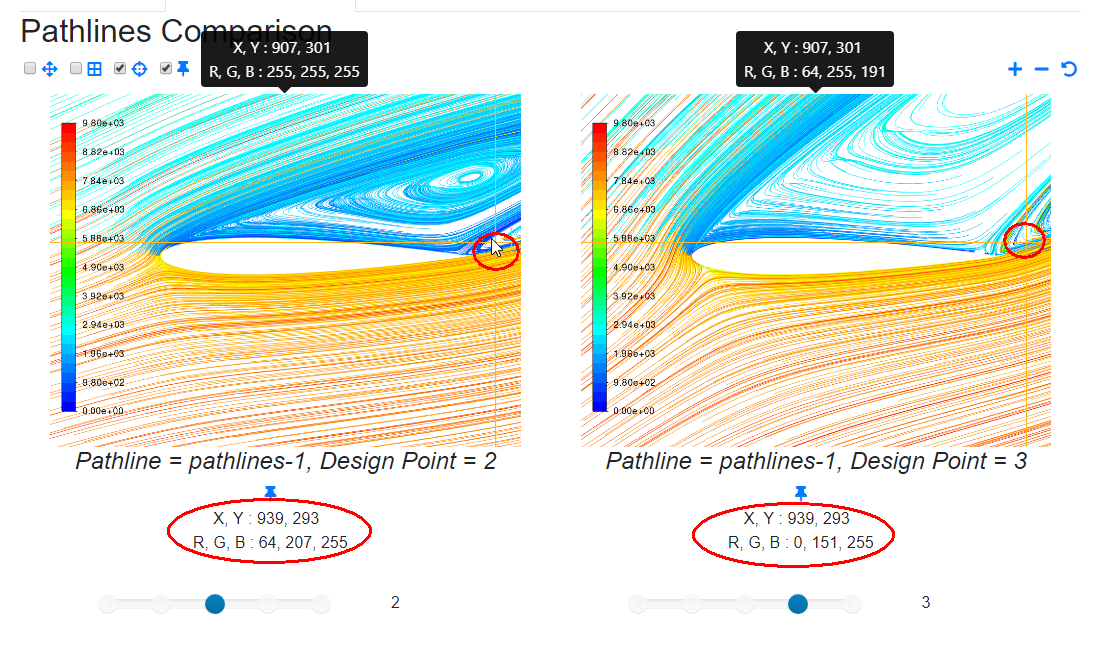
Probe lets you explore the displayed results and obtain specific values within the display (X, Y coordinates, as well as RGB color values).
Pin, when used in conjunction with the Probe, lets you explore the displayed results and obtain specific values within the display (X, Y coordinates, as well as RGB color values), and upon double-clicking, leaves a 'pinned' marker on the display and reports the values for that pinned probe at the bottom of the comparison chart.
When used in conjunction with the corresponding sliders, you can investigate your results at the same point for various design points.
In addition to results plots, you can also compare XY plots between design points in the parametric report. Filters can be applied within the plot that can show and/or hide relevant design point data. You can also filter the results by input parameter value. In addition, any active filters applied to the plot comparison view are listed at the top of the plot area, along with a button to remove any filters (and reset the filter to its default state), allowing you a convenient way to reset one or more filters quickly and revert back to the original comparison plot.
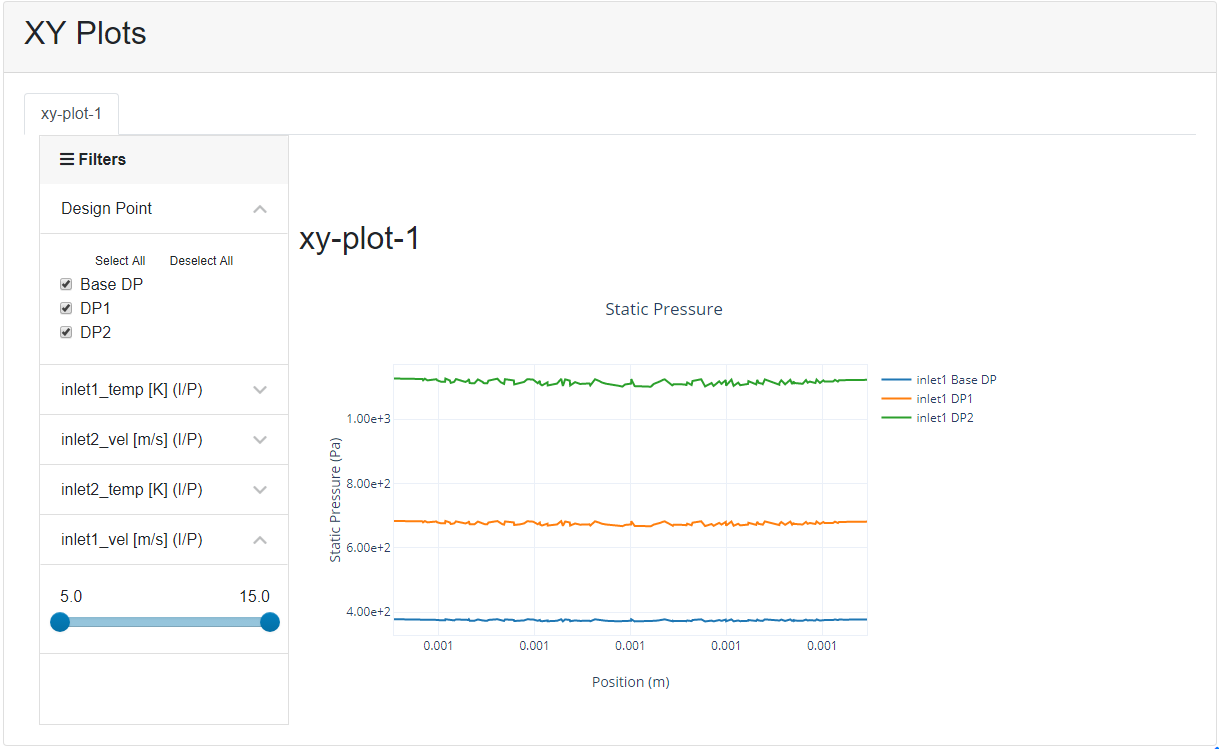
Note: Parametric reports exported to HTML will show the dynamic results of the XY plot comparison however, those exported to PowerPoint and/or PDF will only present a static view of the XY plot based on settings used at the time the report was generated.
When you are satisfied with your simulation setup and results, and have configured your report to your satisfaction, generate a parametric report using the Generate button at the bottom of the task page. See Generating Simulation Reports for more information.
Once the parametric report is generated, it appears in its own tab alongside the graphics window. Alternatively, you can use the View button at the bottom of the task page. See Viewing Simulation Reports for more information.
Once generated, you can save your reports as PDF or standalone HTML using the Export button at the bottom of the task page. See Saving Simulation Reports for more information.