


As your design points are updated, you can monitor and view their status in the Design Point Table (under Status), as well as in the Update Status category of the Parametric Ribbon.
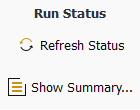
Use the Show Summary... button to display the Count of Design Points Based on Status dialog box that provides a summary of the various state(s) of your design point(s).
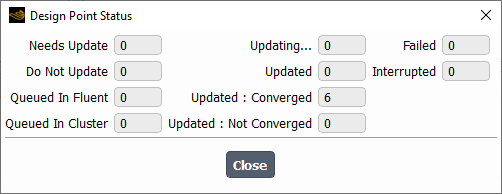
From here, you can monitor how many simulation runs:
Needs Update: indicates how many design point simulation runs still need to be updated.
Do Not Update: indicates how many design point simulations have been designed not to be updated.
Queued in Fluent: indicates how many design point simulations are waiting to be executed in Fluent.
Queued in Cluster: indicates how many design point simulations are waiting to be executed in the cluster.
Updating...: indicates how many design point simulations are currently being updated.
Updated: indicates how many design point simulations have been updated.
Updated: Converged: indicates how many design point simulations have been updated and have a converged solution.
Updated: Not Converged: indicates how many design point simulations have been updated and do not have a converged solution.
Failed: indicates how many design point simulations have failed to be updated.
Interrupted: indicates how many design point simulations have been interrupted.
Note: Whenever any design point is in the Updating... or Queued in Fluent or Queued in Cluster state:
Under Study in the Ribbon, the Duplicate button is disabled.
Under Update Options in the Ribbon, the Sequential and Concurrent radio buttons are disabled.
In Parametric Study Tree View, the Set As Current, and the Duplicate context menu options are disabled.
Corresponding text commands for these functions are also disabled.
As the design point simulation runs progress, click the Refresh Status button to obtain the latest status of the design points that are being updated in the session, if any. Preferences are available for automatically refreshing your design points, see Setting Preferences for Parametric Studies for details.
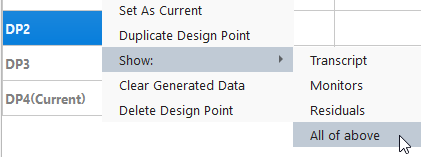
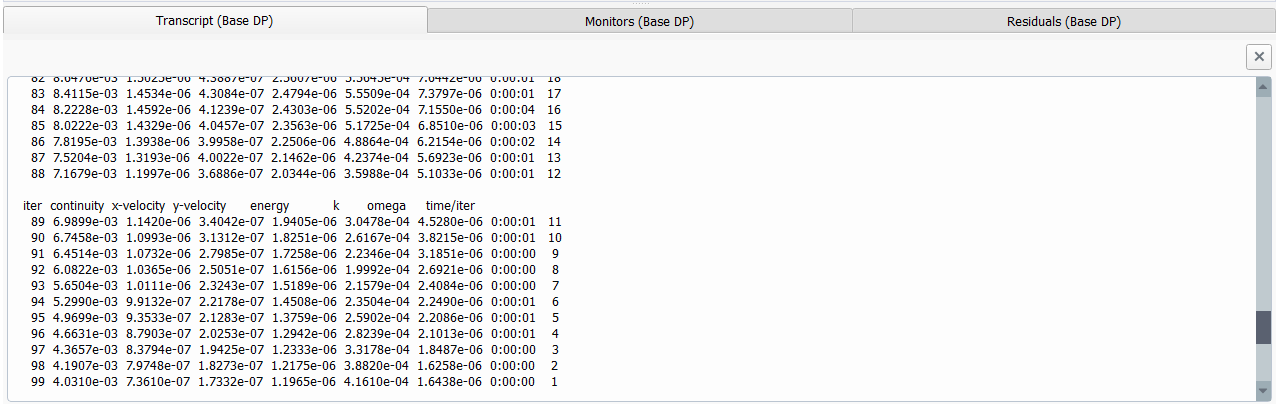
Alternatively, you can right-click the design point name in the Design Point Table, and select the Show: option. Here, you can show the run's transcript details, its monitors, residuals, or all of them in a series of tabs.
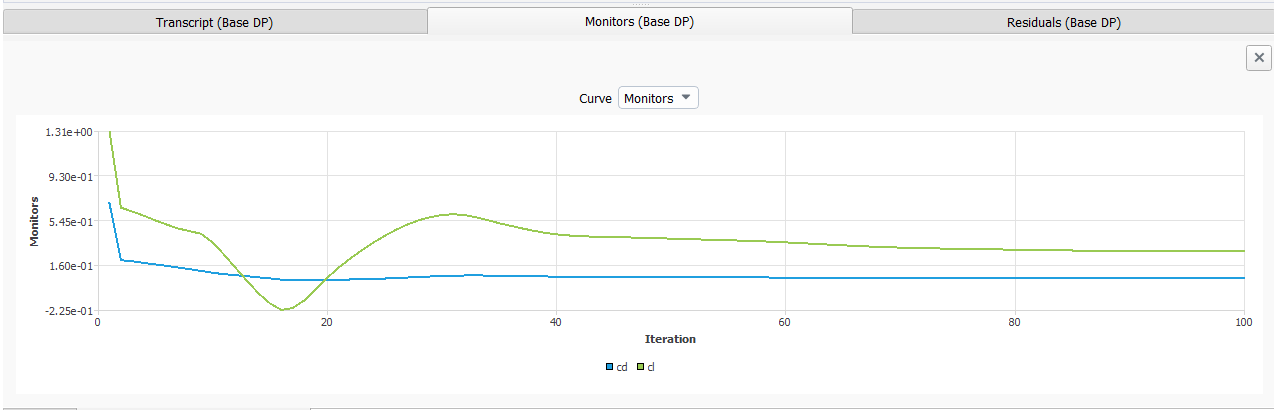
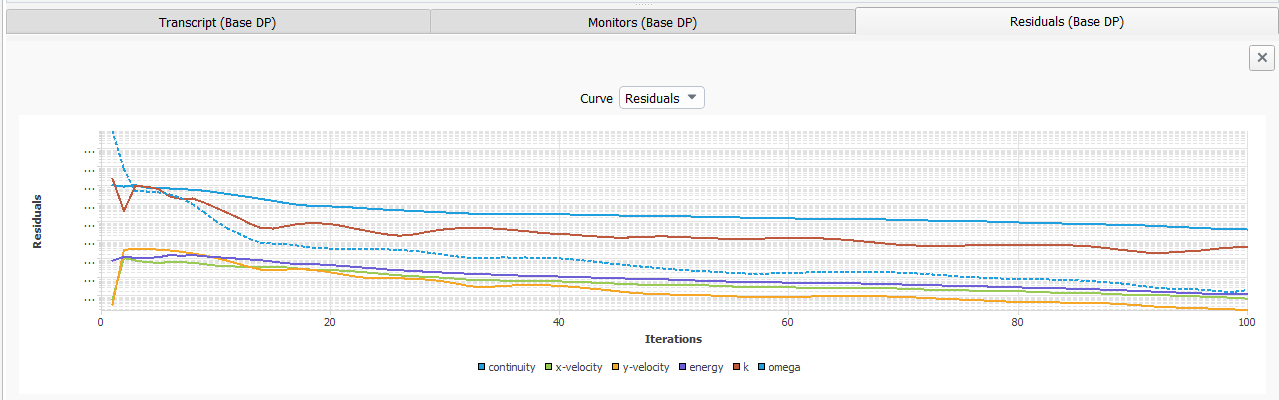
Note: To ensure residual plots always represent the true progress of the solution through the design points, it is recommended that you set the Iterations to Plot and Iterations to Store settings in the Residual Monitors dialog box to a value that represents the maximum number of iterations that are possible given the current solver settings (maximum number of iterations per timestep multiplied by the number of timesteps).
Graphical plots such as monitors and residuals can be altered according to your needs. See Customizing Graphical Plots for more information.
When you have more than one updated design point, you can export your Fluent parametric design point data and use it in optiSLang by using the Data Export drop-down menu in the optiSLang Capabilities category of the Parametric Ribbon.
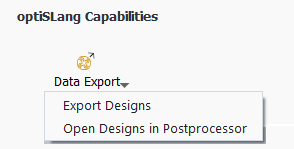
Use the Export Designs option to generate an optiSLang-compatible output file to a location of your choice, containing the details of the updated design points.
When automatically adding design points using optiSLang (Automatically Adding Design Points), you can open optiSLang directly using the Go to optiSLang option.
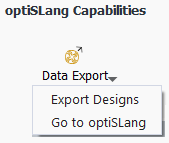
The Go to optiSLang button is available when designs of experiments (DOEs) are created using optiSLang and the optiSLang project exists in the simulation directory. Clicking on this button creates a copy of the optiSLang project from the simulation directory (
*.opf), places it inside your working directory (as designated in the Fluent Launcher, and opens the copied project in optiSLang.Note: Since optiSLang and Fluent are not connected in any way, any changes made in the open optiSLang project are not available in Fluent.
Once you have updated your design points, use the Open Designs in Postprocessor option to open the optiSLang postprocessor using a generated optiSLang-compatible output file (located, by default, under the current simulation directory) containing the details of the updated design points.
For optimization studies (Creating and Optimizing Designs of Experiments for optiSLang), once you have updated your design points, use the Open OMDB in Postprocessor option to load the optiSLang Monitoring Database into the optiSLang postprocessor. The database contains the details of the optimizations such as all of the designs with their input parameter values, their responses, and so on. Opening the database in the optiSLang postprocessor allows you access to various different types of charts.
For optimization studies (Creating and Optimizing Designs of Experiments for optiSLang), once you have updated your design points, use the Export Optimization Results into CSV option to convert your optimization results into a comma separated value (CSV) file that can be examined as a spreadsheet.
The equivalent text command interface (TUI) commands
(export-designs, go-to-optislang, and
open-designs-in-optislang-postprocessor) exist under the
parametric-study/design-points/auto-create/ menu.
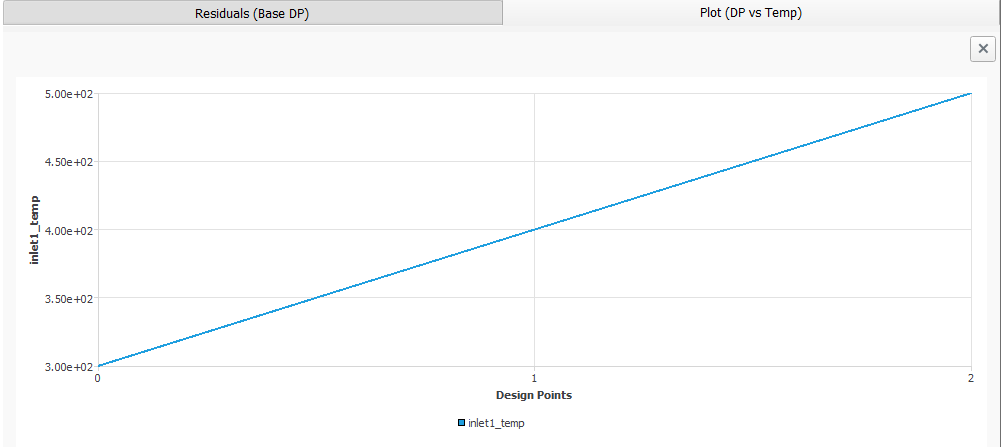
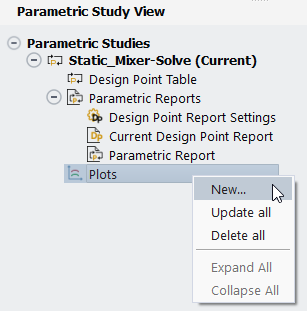
Use the Parametric Plots dialog to create and compare plots between a parametric study's design points and their input and output parameters. Double-click the Plots node in the Parametric Study View to open the Parametric Plots dialog.
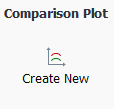
You can also create new comparison plots for your design point runs using the Create New option under Comparison Plot in the Parametric tab of the Ribbon.
Alternatively, you can select the New... option from the Plots context menu to open the task page.
![]() Parametric Study View → Parametric
Studies → Plots
Parametric Study View → Parametric
Studies → Plots
![]() New...
New...
With the Parametric Plots dialog, you can create and display plots that contain your design point input parameters and output parameters and easily visualize them in the Parametric Study view.
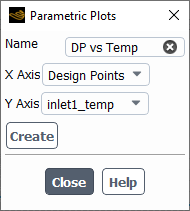
Specify a Name for the parametric plot.
Use the X Axis and the Y Axis drop down lists to specify the plot's x-axis and y-axis variables. These lists contains your study's input and output parameters.
Click Create to create the plot, add it to the plots tree, and display it in the assigned window.
Your design point monitor and residual plots can be customized by using the plot's context menu to expose various customization menus.
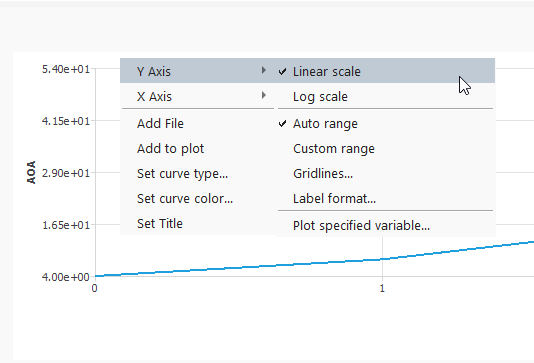
With this context menu, you can customize the following plot settings:
Set X and Y axes
Change the scale to linear or logarithmic
Change the range of the plot
Change the number of grid lines
Change the label formatting
Add a specific variable to the plot
Add a file to the data set
Add a curve to the plot
Change the type of curve
Change the color of the curve
Change the title of the plot