


Under Image Settings, you can choose the default view orientation and resolution for your included graphics results (such as saved views/states, or common orientations such as top, bottom, left, right, and so on).
The default is Object State View (the most recent saved state of the corresponding view). These settings will be applied to all the graphics results images in your report. Use the Preview View button to display a preview of an image with your image settings in the graphics window.
Customize the image resolution using the X Resolution and the Y Resolution fields. These let you control the resolution at which the graphics are captured for use in the simulation report. By default, the values are set to those found in the Save Picture dialog (Using the Save Picture Dialog Box). Use the Capture Current Resolution button to obtain the current resolution settings for the current graphics window.
If you want to save your results as separate image files (hard copies), enabling the Save Hardcopy check box will save a separate image file to your working folder.
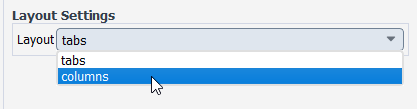
For the various types of results plots (contours, vectors, etc.) you can change various aspects of the general layout under Layout Settings.
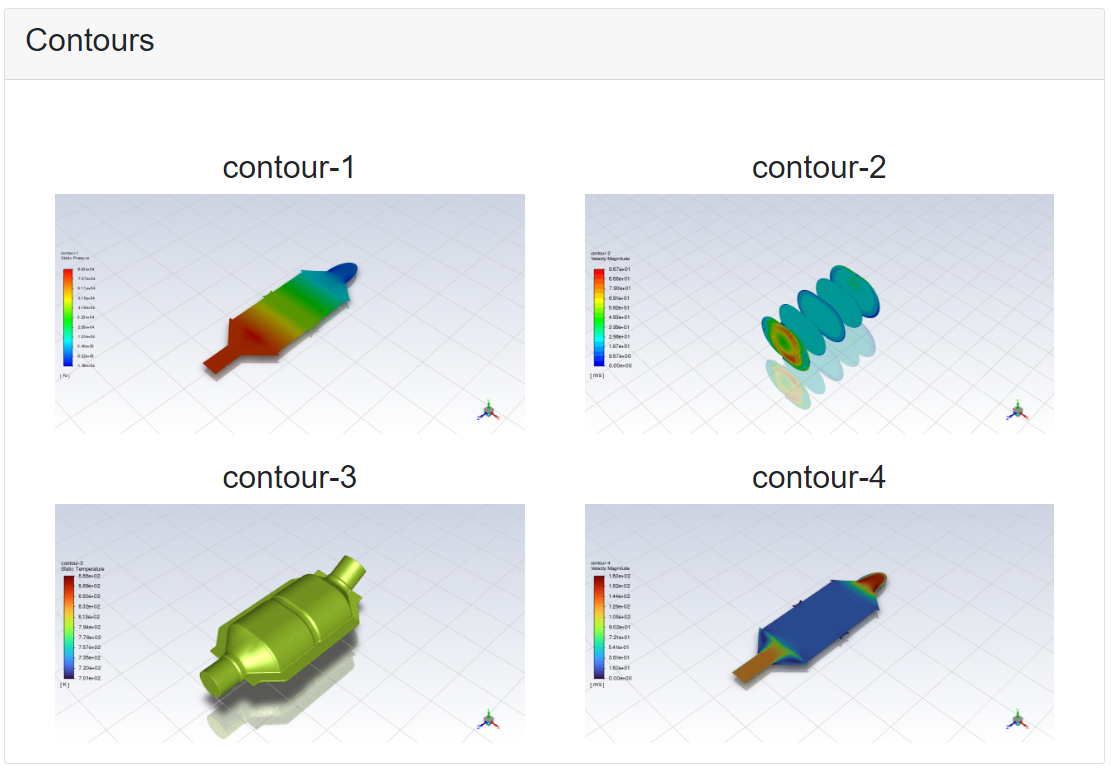
Use the Layout field to control the arrangement of multiple plots. By default, when tabs is selected, multiple plots of the same type are presented in separate tabs. You can also choose columns so that multiple plots are arranged in a tabular format and can be viewed at the same time. When you choose columns, the Number of Columns field becomes available and is set to 1 by default. but can be set to an appropriate value.
The layout setting can be applied per category (just for a series of contour plots, or a series of vector plots, etc), or as a general setting to apply to all your result plots (see Setting General Report Properties for more information).
You can save your custom simulation report configuration settings (availability of particular nodes, headings, graphics, notes, etc.) as a separate template file so that you can easily recreate your specialized simulation reports for later use. You can access report templates using the icons in the upper portion of the task page.
 : opens a file
browser where you can locate and select a Fluent simulation report template
(
: opens a file
browser where you can locate and select a Fluent simulation report template
(*.fsrt) file that contains customized settings. : opens a file
browser where you can specify the location and the name of a Fluent simulation report
template (
: opens a file
browser where you can specify the location and the name of a Fluent simulation report
template (*.fsrt) file where you can save your report settings for later use.
Customizations to your reports can be the inclusion or exclusion of any sections of the report, the order of the sections, notes, and the inclusion or exclusion of various other details of the report.
Note: While recording a journal of your session, whenever your simulation involves setting up and generating a simulation report, Fluent uses locally stored report templates during the journaling process to keep track of your report settings.
If you would like to add one or more specific graphics that are not part of the default definitions of your report, you can add it as part of the User Data node of the report.
Add external graphic images to your report:
Specify the appropriate Image Path for your external graphics image file, or browse for the appropriate file and its directory.
Specify the appropriate Image Name for your external graphics image file.
Select Add Image to add the image to your report.
Add graphics from your simulation directly to your report:
In your simulation, proceed to set up a specific view in the graphics window, whether its a specifically orientated mesh display, plane cut, etc.
Right-click in the graphics window and select Add to Report from the context menu. This will capture the graphics window contents.
Note the new image file listed under User Data in the Simulation Report task page.
Click Generate to regenerate the report with the new image under the User Data section.
By default, all report sections are included in a simulation report, as indicated by the check box in the Report Section outline view. To obtain a more simplified and customized report, deselect any of the selected nodes and click Generate. The resulting report will include only those selected sections.