


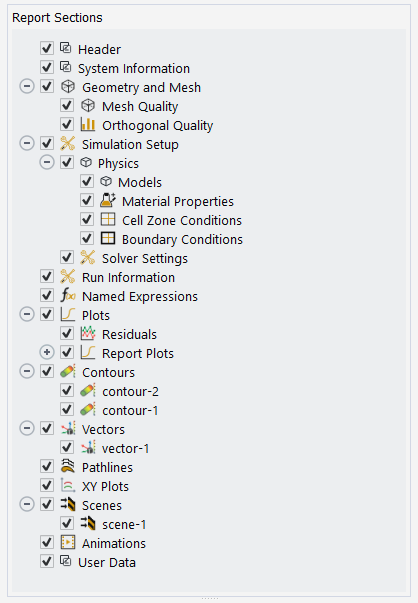
By default, the simulation report contains basic information about your simulation, with the ability to provide some additional information. Select a node under Report Sections to view that section's information.
Header information includes fields for the Analyst name, and the Date (by default). Additionally, you can specify your Company name and your Logo image file. Further more, there are additional options for URL, Phone and Fax numbers, Address information, and a Description for the simulation.
You can provide custom Descriptions for the remaining sections:
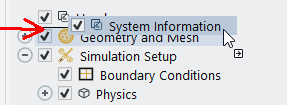
System Information
Geometry and Mesh, including the Mesh Quality and Orthogonal Quality sections
Simulation Setup, including the Solver Settings and Physics sections (which itself contains sections for Models, Material Properties, Cell Zone Conditions, and Boundary Conditions)
Run Information
Solution Status
Named Expressions
Report Definitions
Plots, including Residuals and Report Plots, if available. Additionally, you can specify Line Type(s) and Line Marker(s) for your plots.
Any available graphics objects that you want to include in your report, such as Mesh, Contours, Vectors, Pathlines, LICs,XY Plots, FFT, Scenes, Animations, Histograms, or your own custom view(s). Additionally, you can display the object using a particular orientation using the View field (front, back, left, bottom, isometric, etc.). Use the Preview View button to see what the image will look like once it is in the report. The isometric view is the default orientation.
User Data, if available.
Solution Status
Each of these components can be disabled so that they are not included in the final report.
Use the  icon to deselect the actively
selected node and clear any displayed settings.
icon to deselect the actively
selected node and clear any displayed settings.
Under Report Settings, there are several aspects of your simulation report that you can control from a global perspective.
Visibility - use the check boxes to include/exclude all or parts of the report.
Layout Settings - choose whether the layout of your results plots (such as contours, vectors, etc.) will be included in your report as a series of tabs, or in tabular columns. These settings will be applied to all the graphics results images in your report. See Changing the Layout of Your Results for details.
Image Settings - choose the default view orientation and resolution for your included graphics results (such as saved views/states, or common orientations such as top, bottom, left, right, and so on). See Customizing Your Report Image Settings for details.
Theme Settings - choose the Use Dark Theme option to present your simulation report (and included plots) with a dark background and white text, with any graphics result images remaining as they were originally captured. The Use Dark Theme option will be enabled by default if you have chosen to run Ansys Fluent using the Dark theme preference (see Customizing the Graphical User Interface and Setting User Preferences/Options).
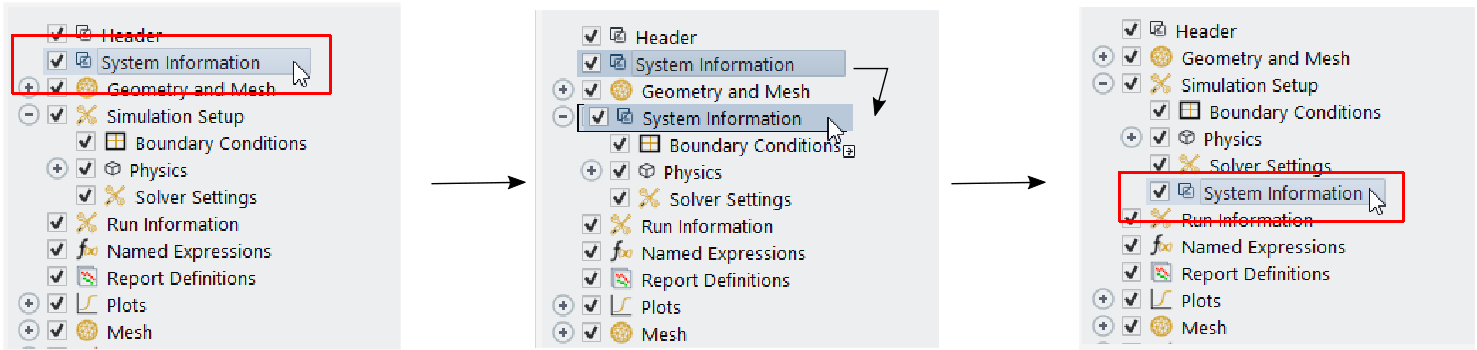
To obtain a more customized report, you can reorganize elements of your report prior to generating it. To do so, drag and drop elements of the report section tree onto other portions of the tree to rearrange the order and contents of various sections of your simulation report.
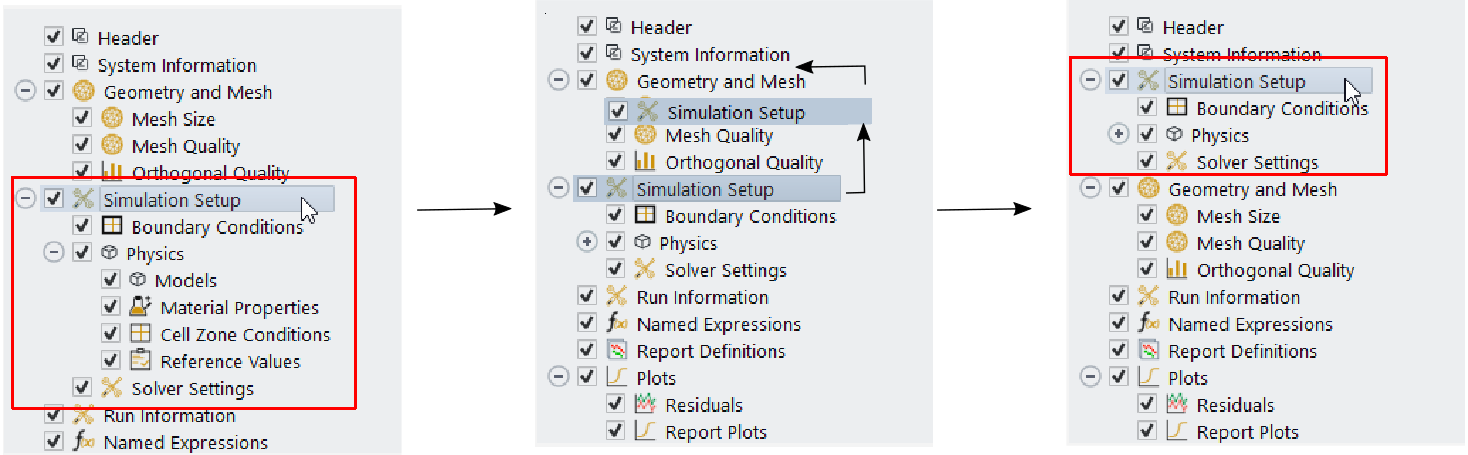
Typically, you can drag and drop one or more selected item(s) onto a node and it/they will be added to the bottom of the sub-nodes.
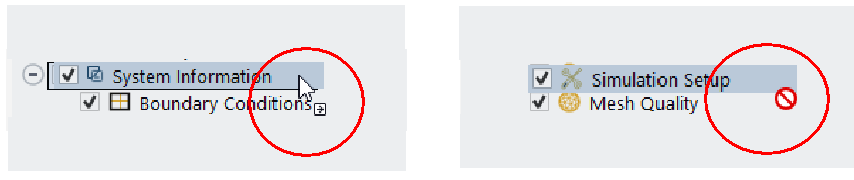
As you select items in the tree and drag them elsewhere in the tree, the cursor changes
accordingly, indicating whether you can (![]() ) or cannot (
) or cannot (![]() ) drop the
selected item at that location.
) drop the
selected item at that location.
When trying to position a selection between two nodes, a line appears between the two nodes, indicating that placement between those nodes is acceptable.
The following caveats exist when organizing your report sections.
The Header section must always be at the beginning of the report, and therefore at the top node of the tree.
Elements of specialized container nodes - ones that have their sub-nodes arranged as tabs in their respective containers (such as Contours, Vectors, etc.) - cannot have their contents changed. Nothing can be added to these containers, and nothing from these containers can be moved elsewhere.