


A Modal analysis involving cyclic symmetry includes additional options to help you navigate and interpret the results. In particular, there are features to:
Review the complete range of modes: you may request the modes to be sorted by their serial number in the results file or by their frequency value in the spectrum.
Review combinations of degenerate modes through the complete range of phase angles.
When simulating cyclic symmetry in a Modal analysis, the same results are available as for a modal analysis with full symmetry, with the exception of Linearized Stresses (which are underdefined). In addition, purely elemental results, such as Volume, Kinetic Energy, and Potential Energy display only in the base sector. To verify a result is elemental, examine the Worksheet (from the Solution object) for Solution Quantities and Result Summary > Available Solution Quantities.
Although only one cyclic sector is analyzed, results (excluding elemental results) are valid for the full symmetry model. You can control the post-processing and display of cyclic results using the following options of the Cyclic Solution Display category of the Solution folder:
Number of Sectors: This option controls the extent the model is expanded from the raw solution. The value indicates how many sectors should be processed, displayed and animated. Results generate more quickly and consume less memory and file storage when fewer sectors are requested. To set the value as Program Controlled, enter zero; this value reveals the full expansion.
Starting at Sector: Selects the specific sectors to include within the expansion. For example, if Number of Sectors is set to 1, sectors 1 through N are revealed one at a time. To set the value as Program Controlled, enter zero; this value reveals the specified number of sectors from sector 1 onwards.
In addition, individual result objects contain a Starting at Sector property. For it to display, the Number of Sectors property above must be set to a value greater than 0. Furthermore, this property overrides the setting of the above Starting at Sector property of the Solution object. This property gives you the ability to define different starting sectors for each result object.
Note:
Extremum values (for example, Minimum, Maximum) correspond only to the portion of the model selected by these properties (under Cyclic Solution Display).
To expand a mode shape, Mechanical applies the scale factors as defined in the Complete Mode Shape Derivation section of the Mechanical APDL Theory Reference. Normalization to unity is not supported.
For a Multistage Cyclic Symmetry analysis, the Number of Sectors and Starting at Sector properties apply to all Stage objects.
Because these features involve reviewing the mode shapes and contours at individual points within a range, they leverage the charting facilities of the Graph and Tabular Data windows together with the 3D contour plotting of the Graphics view.
Reviewing the Complete Range of Modes
You may request the modes to be sorted in the Graph window by their set number in the results file or by their frequency value in the spectrum. You may then interact with the plot to generate specific mode shapes and contours of interest.
Use the X-Axis property of the Graph Controls category in the Details pane of the result to control how modes are sorted. Property options include:
- Mode
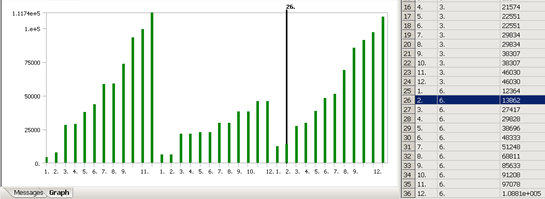
This choice will designate the x-axis in the Graph window to indicate the set numbers for each mode (within a harmonic index) in the results file. Each mode will have a vertical bar whose height represents its frequency of vibration. The columns in the Tabular Data window are displayed in the order of: Mode, Harmonic Index, and Frequency.
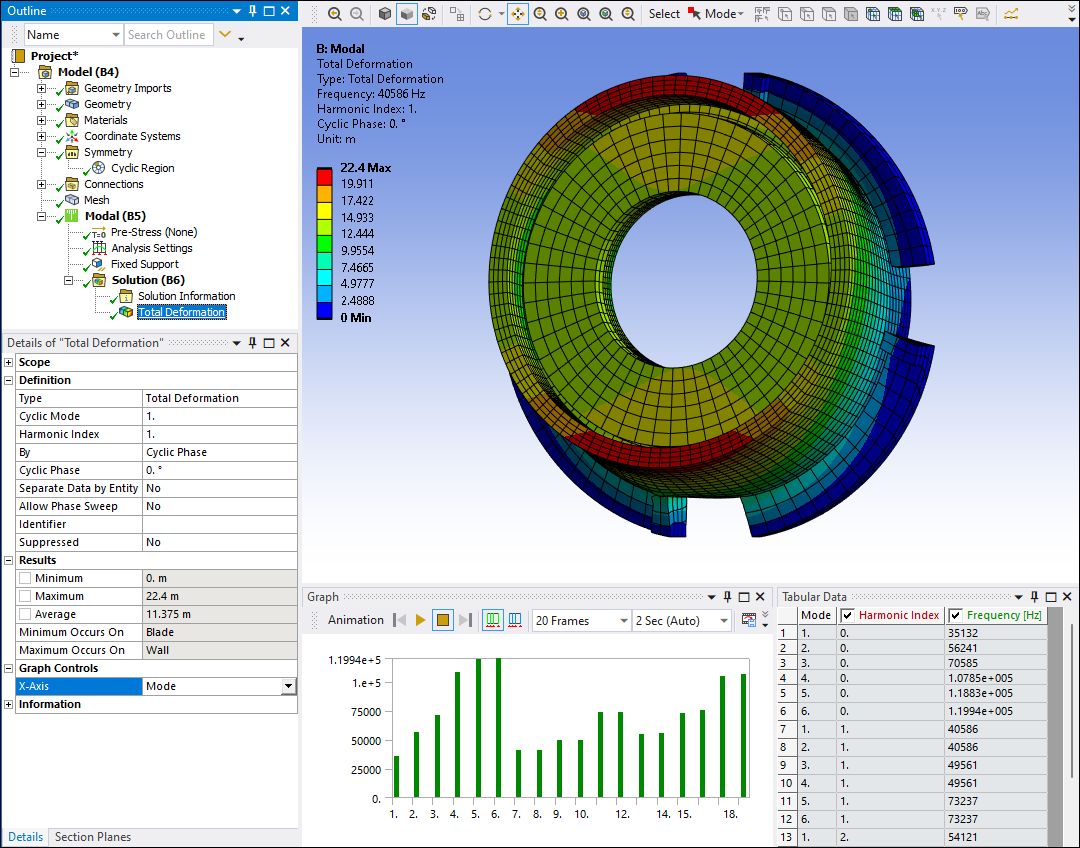
When X-Axis is set to Mode, the Definition category includes settings for Cyclic Mode and Harmonic Index.
- Frequency
This option will designate the x-axis in the Graph window to indicate the mode Frequency. Modes are thus sorted by their frequencies of vibration. Each mode will have a vertical bar whose height, for cross-reference, corresponds to the mode number (within its harmonic index). The columns in the Tabular Data window are displayed in the order of: Frequency, Mode, and Harmonic Index.

When X-Axis is set to Frequency, the Definition category includes a setting for Cyclic Phase. Read-only displays of the Minimum Value Over Phase and the Maximum Value Over Phase are also available.
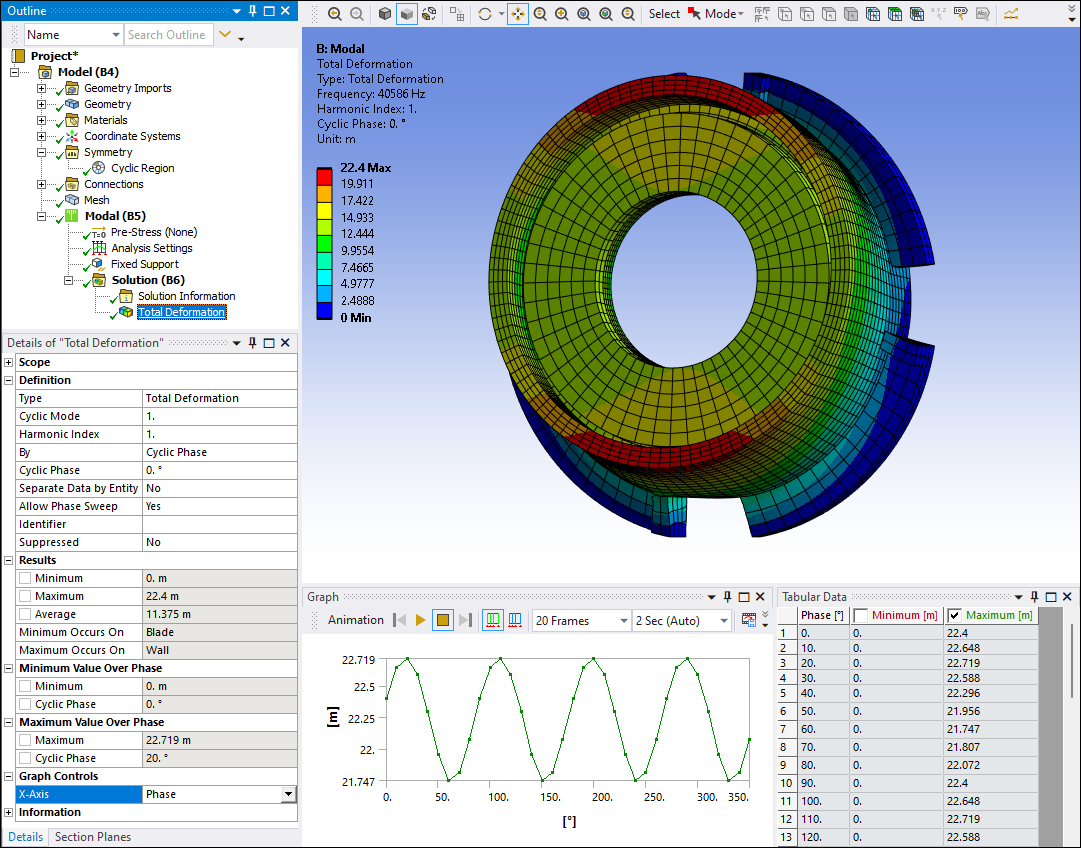
- Phase
For degenerate modes or couplets, a third option for the X-Axis setting under Graph Controls is available. This choice will designate the x-axis in the Graph window to indicate the phase angle. The graph will show the variation of minimum and maximum value of the result with change in phase angle for the concerned couplet. This setting allows you to analyze the result for a particular mode (for couplets only). The columns in the Tabular Data window are displayed in the order of: Phase, Minimum and Maximum. For details on couplets, read the section below.
Reviewing results for frequency couplets as a function of cyclic phase angles
An inspection of the results for harmonic indices between 0 and N/2 (that is, 0 < Harmonic Index < N/2) reveals that natural frequencies are reported in pairs by the solver. These pairs of equal value are often termed "couplets." The corresponding mode shapes in each couplet represent two standing waves, one based on a sine and another on a cosine solution of the same spatial frequency, thus having a phase difference of 90°. To appreciate the full range of vibrations possible at a given frequency couplet, it is necessary to review not only the individual mode shapes for sine and cosine (for example, at 0° and 90°) but also their linear combinations which sweep a full cycle of relative phases from 0° to 360°. This sweep is displayed by Mechanical as an animation called a "traveling wave". The following is an example:
Note: The following demos are presented in animated GIF format. View online if you are reading the PDF version of the help.
Animations for mode shapes in other harmonic indices, that is, 0 or, for N even, N/2, will yield standing waves. The following animation is an example of a standing wave.
There are options to review the dependence of a result on cyclic phase angle quantitatively. For applicable harmonic indices, results can be defined by:
Cyclic Phase: Use in combination with the Cyclic Phase setting to report the contour at a specific phase. Under this setting, the result will also report the Minimum Value Over Cyclic Phase and the Maximum Value Over Cyclic Phase.
Maximum over Cyclic Phase: this contour reveals the peak value of the result as a function of cyclic phase for every node/element.
Cyclic Phase of Maximum: this contour reveals the cyclic phase at which the peak value of the result is obtained for every node/element.
When the result is defined by Cyclic Phase, it may be convenient to use the interaction options to pick the value of phase from the Tabular Data window as an alternative to direct input in the Details view. To access this feature, set the X-Axis to Phase under Graph Controls.
To control the density of the cyclic phase sweep, select from the File tab, and then select the Frequency category. Modify the Cyclic Phase Number of Steps property.
The phase sweep can be disabled individually on a result by setting Allow Phase Sweep to No in the Details view.
Interaction Options
The Graph, Tabular Data and the Graphics view can be used in concert while reviewing modal cyclic results. For example, if you click in the Tabular Data window, a black vertical cursor moves to the corresponding position in the chart. Conversely, if you click a bar (for Mode or Frequency display) or a node in the chart (for a Phase display), the corresponding row is highlighted in the Tabular Data window. Multi-selection is also available by dragging the mouse over a range of bars or nodes (in the chart) or rows in the Tabular Data window. These are useful in identifying the mode number and harmonic index with specific values of the frequency spectrum.
Also, the Graph or Tabular Data windows can be used to request a specific mode shape at a phase value of interest (if applicable) using context sensitive options. To access these, select an item in the Graph or Tabular Data windows and click the right mouse button. The following are the most useful options:
Retrieve This Result: Auto-fills the Mode and Harmonic Index (for a Mode or Frequency display) or the Phase angle (for a Phase display) into the Details view of the result and will force the evaluation of the result with the parameters that were recently changed.
Create Mode Shape Results: processes the selected pairs (Mode, Harmonic Index defined by dragging in the Graph window to produce a light blue rectangle) and inserts results under the Solution folder. You must then evaluate these results, since they are not evaluated automatically. This option is not available for Phase display.
The following two options are available only if you click the right mouse button in the Graph window:
Zoom to Range: Zooms in on a subset of the data in the Graph window. Click and hold the left mouse at a step location and drag to another step location. The dragged region will highlight in blue. Next, select Zoom to Range. The chart will update with the selected step data filling the entire axis range. This also controls the time range over which animation takes place.
Zoom to Fit: If you have chosen Zoom to Range and are working in a zoomed region, choosing Zoom to Fit will return the axis to full range covering all steps.