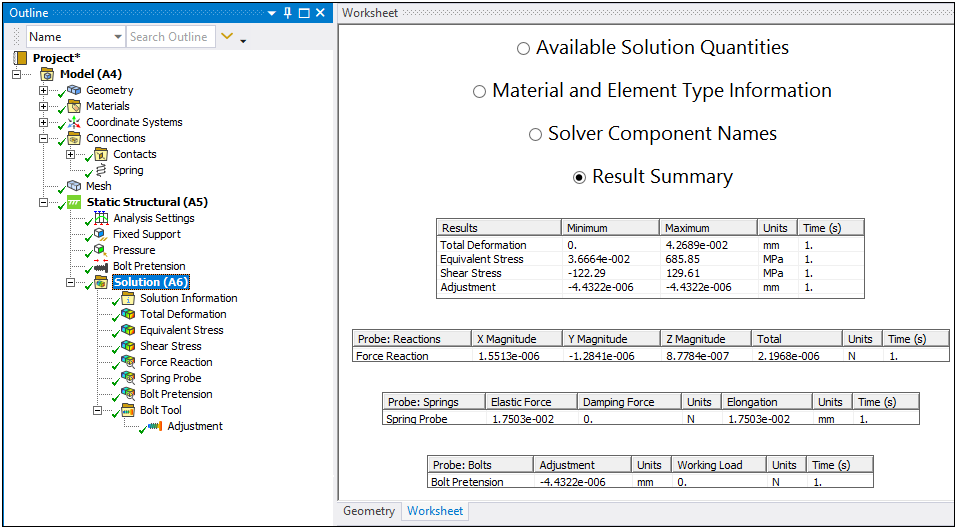
Once your solution is complete, you can display the Solution Quantities and Result Summary page of the Worksheet by either selecting the button on the Home tab or by right-clicking on the Solution object and selecting the option .
As illustrated in the images below, the Worksheet Solution Quantities and Result Summary provides the following options at the top of the page:
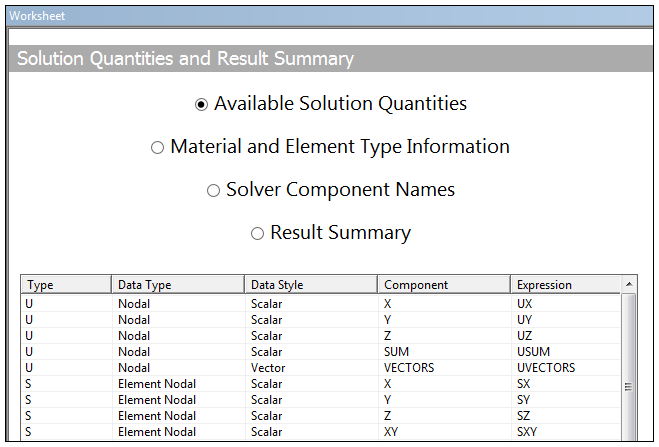
- Available Solution Quantities
This option provides a list of the User Defined Results available in the result file. See the Application section of the User Defined Results section of the Help for the steps to use the Worksheet content available for this option.
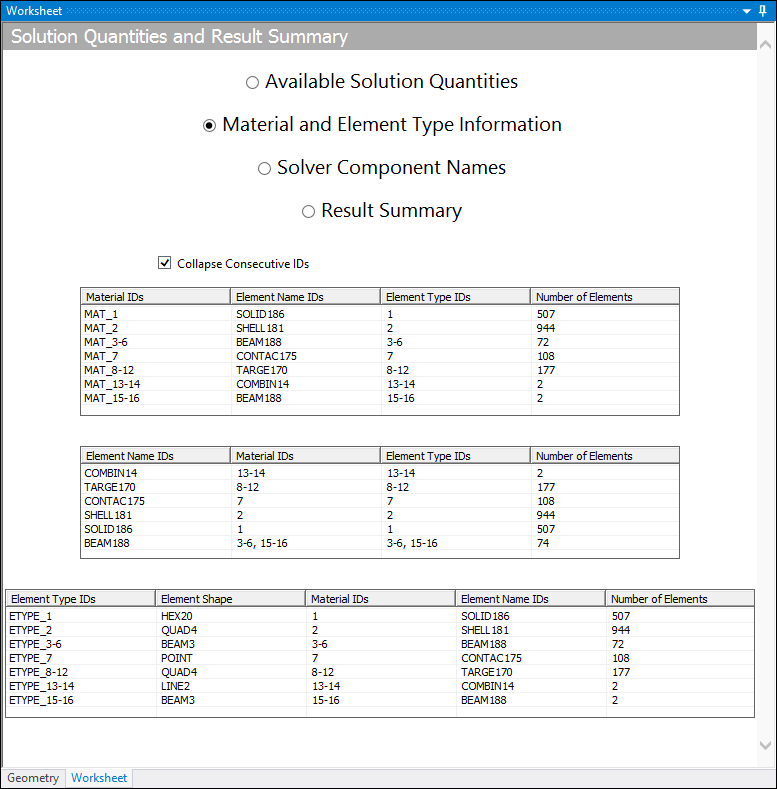
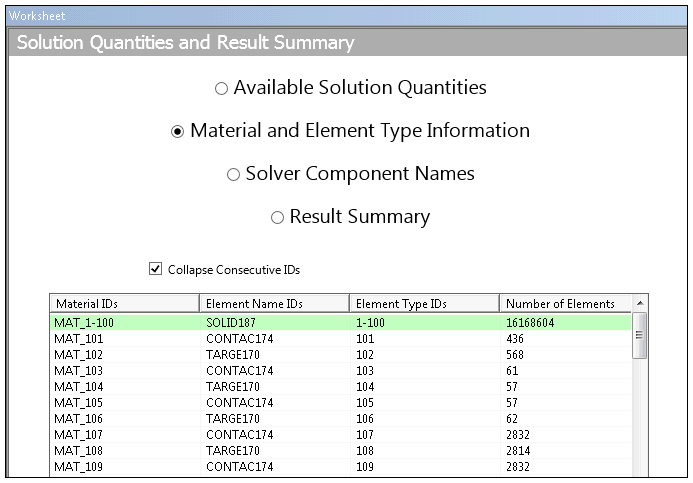
- Material and Element Type Information
This option displays a summary of all the Material and Element Type data present on the results file. You can use this data as a scoping option for new result calculations. See the Result File Item Worksheet Features topic below for the features available for this Worksheet selection.
Important: If your analysis includes a Condensed Part and a result is using the option for the Scoping Method, Material IDs and Element Name IDs are not available for the Material and Element Type Information selection on the Solution Quantities and Result Summary page.
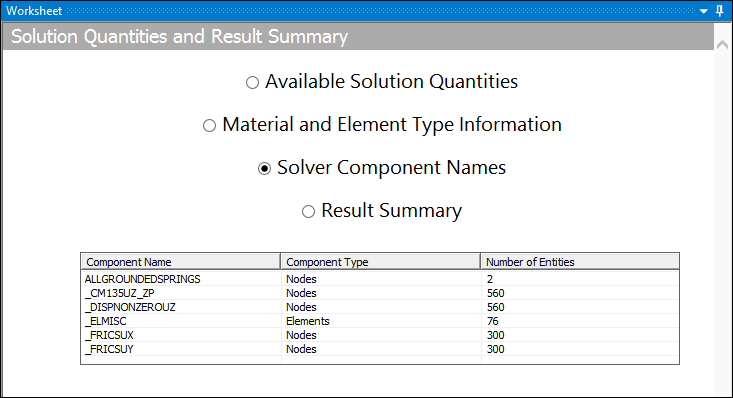
- Solver Component Names
This option lists the Mechanical APDL Solver components present on the results file. These components are 1) node- or element-based groupings, 2) node- and element-based Name Selections that were written to the result file from Mechanical, or 3) components that the solver needed to generate in order to properly solve the analysis. Solver generated components typically contain an underscore (i.e. "_") at the beginning of the Component Name. You can use these components a scoping option for new result calculations. See the Result File Item Worksheet Features topic below for the features available for this Worksheet selection.
- Result Summary
This option provides a tabular display of the minimum and maximum values of the available results, the associated unit of measure, and time step values.
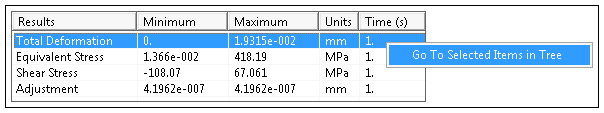
Result Summary Features
For the results displayed by the Result Summary option, each table entry provides the right-click option, , to select and then graphically display the corresponding result object.
If a result is included in the tree but not yet evaluated, indicated by a yellow thunder bolt icon, the Worksheet displays a value of zero (note table entries above).
Result types supported by this feature include:
Normal Contour/Vector type results such as Stress, Temperature, and Deformation.
User Defined Results.
Force and Moment Reaction Probes.
Joint Probes reporting Force or Moment.
Spring Probes.
Bolt Pretension Probes.
Result File Item Worksheet Features
As described below, the Worksheet for the Material and Element Type Information and Solver Component Names options offers a number of use features.
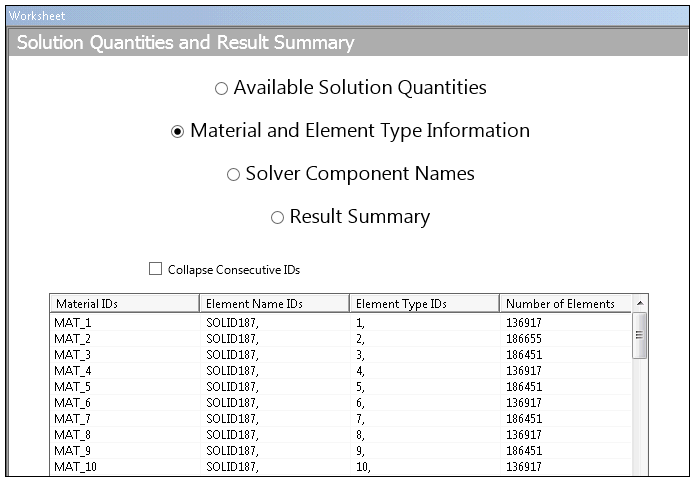
- Collapsing Consecutive IDs
The Collapse Consecutive IDs option is available for the Material and Element Type Information Worksheet display. As highlighted, this option organizes like materials and/or elements into singular rows in the table as opposed to creating a lengthy table list that repeats the same ID information. This option is active by default. Note that Element Type IDs do have a consecutive range of values and that this option displays this range when collapsed.
- Contextual Menu Options
You can right-click on a table listing to display options that enable you to automatically create a result. Based on your analysis type, the options include , , and for structural analyses and and for thermal analyses.


Important: If you are performing a Fracture analyses that includes a crack, the application automatically generates three Named Selections for the top and bottom face nodes as well as for the crack front nodes (if the Crack Faces Nodes property is set to ). The application displays these Named Selections in the Solver Component Names summary, as shown above (CRACKT_SUR_01, CRACKT_SUR_02, and CRACKT). The right-click options for these three table cells produce results that display contour colors at the scoped nodes only (as defined by the Named Selections). The remainder of the part displays as grey and translucent, as illustrated in the following example.

The contextual menu also includes the option . This option displays the elements or nodes on your model that are associated with the data (row or rows) selected in the Worksheet. In order to see these associated nodes and/or elements, you need to move the Worksheet so that you can also see the Geometry window. Refer to the Moving and Docking topic in the Windows Management section.

Note: Double-clicking a single Worksheet row also plots the node selections for that row. This feature only works for a singular selection.
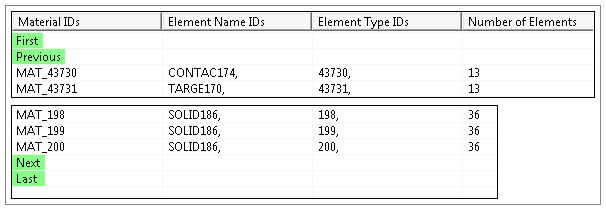
- Previous and Next Selections
For the Materials and Element Type Information and the Solver Component Names selections, when your Worksheet includes more than 200 rows of data, the table provides First/Previous and Next/Last (double-click) options, as illustrated below. These options display at the end of the table as well as at the beginning of the table (once you have advanced to a new page). They enable you to page through the data and/or jump to the beginning and the end of the Worksheet.