


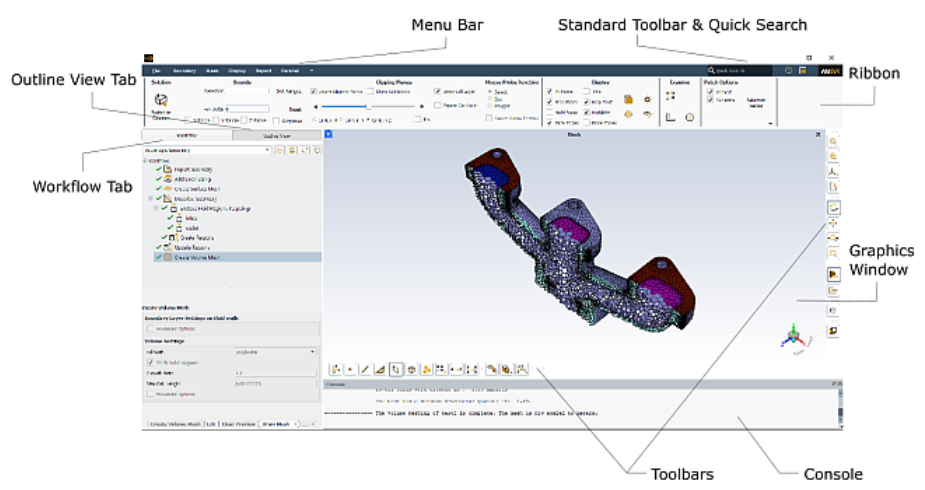
The graphical user interface (GUI) components are illustrated in Figure 1.1: The User Interface Components. The interface will change depending on whether you are in meshing mode (as described in this guide) or solution mode (as described in the Fluent User's Guide). For details on switching between the meshing and solution mode, see Solution.
Object-based meshing is a context-driven, visual workflow, accessible using the major interface components. A complete description of the components is found in the User Interface Components section.
Menu bar commands are appropriate for zone-based meshing or advanced display and report options. Full descriptions of the menu commands are in their related chapters in this manual.
Some of the user interface elements can be moved or tabbed together to suit your preferences. You can also modify attributes of the interface (including colors and text fonts) to better match your platform environment. These are described in Customizing the User Interface.
The help button (![]() ) accesses a drop down list for quick access to the integrated help system, including the Fluent User's Guide. The Fluent integrated help system is described in detail in Using the Help System.
) accesses a drop down list for quick access to the integrated help system, including the Fluent User's Guide. The Fluent integrated help system is described in detail in Using the Help System.
The components are described in detail in the subsequent sections.
In Mesh Generation mode, the ribbon contains options to help with managing the graphical display, selecting objects or zones, and patching options.
Note: When working with CAD Assemblies, certain meshing ribbon tools are disabled.
The hide ribbon button (![]() ) is used to minimize the ribbon, allowing more area for the graphics window. Click a second time to maximize the ribbon to restore the graphics window area.
) is used to minimize the ribbon, allowing more area for the graphics window. Click a second time to maximize the ribbon to restore the graphics window area.
- Solution
The option enables you to switch from meshing mode to solution mode. It transfers all of the volume mesh data from meshing mode to solution mode in Ansys Fluent. You will be asked to confirm the mesh is valid and that you want to switch to solution mode.
Important:Only volume meshes can be transferred to solution mode; surface meshes cannot be transferred.
Face zones which are not connected to volume mesh (geometry objects or unreferenced zones in case of mesh object-based workflow) will be transferred as imported surfaces when the volume mesh is transferred from meshing to solution mode. Also, any unmeshed face zones connected to volume mesh (mesh object with some regions filled or unreferenced zones), will be disconnected and transferred as imported surfaces in solution mode.
You should check that the mesh quality is adequate before transferring the mesh data to solution mode. See Checking the Mesh and Checking the Mesh Quality for details. When you are satisfied with the quality of the generated mesh, you can proceed to solution mode.
Hanging-node meshes are converted to polyhedra during mesh transfer.
Important: In object-based workflows, merging cell zones requires that they be in the same volumetric region.
To merge cell zones that cannot be in the same volumetric region because they are not contiguous, you will need to first delete the object(s) only, and then use the Manage Cell Zones dialog box.
Note:The command
switch-to-solution-modecorresponds to the Switch to Solution button.You cannot switch back from solution mode to meshing mode after the mesh data has been transferred.
However, if no file has been read in solution mode, you can use the command
switch-to-meshing-modeto switch to meshing mode to generate a mesh to be transferred, if you desire.The meshing and solution modes in Fluent have different options available for some user configuration settings. Thus, these configuration settings may be changed when switching from meshing to solution mode and may not be the same when returning to one mode after using the other.
- Bounds
Use the Bounds group to limit the display region based on proximity to a selected entity in your model.
Selection is used to specify the entity on which the Bounds are centered.
You can set a selection filter and then click to select the entity in the graphics window.
Set symmetrical upper and lower distance limits in the +/- Delta text box.
Limit the bounds directionally with the X-, Y-, and Z-Range checkboxes.
Use to apply the display limits. disables the bounds display. You will have to redraw to see the effect.
If Cutplanes is checked, the display region is linked to the Bounds tab in the dialog box. You may insert up to six cutplanes (two in each of the x-, y-, and z-direction) and asymmetrically control their location. See Generating the Mesh Display Using the Display Grid Dialog Box.
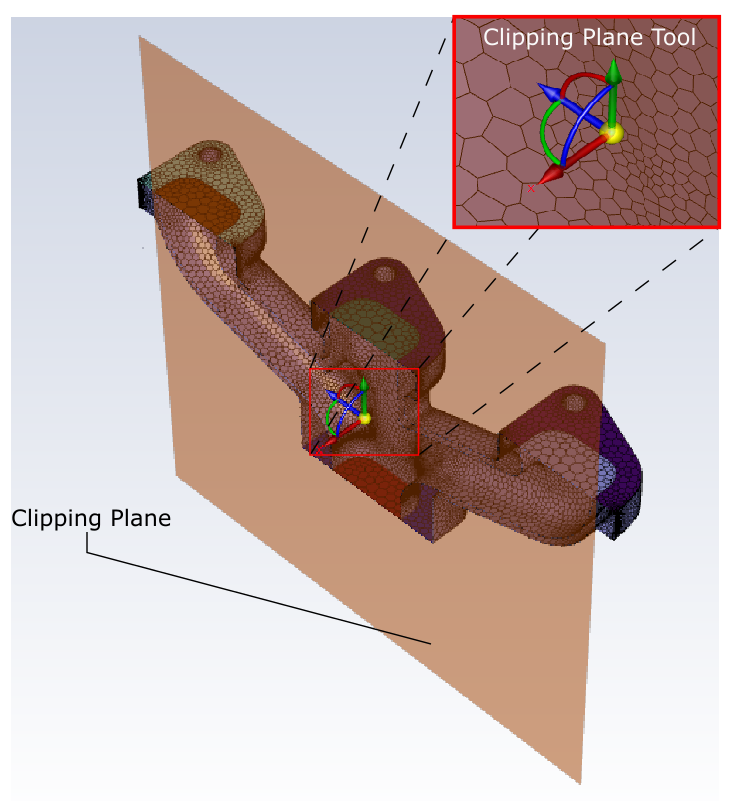
- Clipping Planes
Crops the display region along either a line drawn in the graphics window or along the coordinate system axes when Insert Clipping Planes is enabled. The slider allows interactive position of the clipping plane.
To create a custom clipping plane you can click the Insert Drag Line button (
 ) which allows you to define an arbitrary plane
by drawing in the graphics window. After clicking
the Insert Drag Line button
you can then click once in the graphics window to
initiate the drag line for the plane. After
initiating the drag line, move your cursor across
the model, then click again to end the drag line
and create the custom plane.
) which allows you to define an arbitrary plane
by drawing in the graphics window. After clicking
the Insert Drag Line button
you can then click once in the graphics window to
initiate the drag line for the plane. After
initiating the drag line, move your cursor across
the model, then click again to end the drag line
and create the custom plane.The clipping plane is visible in the graphics window and includes its own clipping tool triad, allowing you to manipulate the plane directly in the graphics window. Select an element of the clipping tool triad, hold down the mouse and then drag, to move or rotate the clipping plane in the graphics window.
Note: The normal of the clipping plane is always oriented along the x-axis of the local coordinate system, hence differing in orientation at times from the graphics window triad and its global coordinate system orientation.
Note: To hide the clipping plane, use the command
"(cx-hide-plane-tool
						"clipping-plane")".
To toggle the display of the clipping plane's triad tool, use either the F10 hotkey or thedisplay/show-hide-clipping-plane-triadtext command.You can control the size of the clipping plane triad using the Graphics triad tool size field in the Graphics branch of Preferences (File>Preferences...). Note that the updated tool size only appears after restarting the Fluent application.
Use the Flip checkbox to reverse the direction of the clipping plane.
Use the Show Cut Edges option to display the cut edges of the model exposed by the clipping plane. This option is disabled by default.
Use the Draw Cell Layer checkbox to visualize a layer of cells of the volume mesh on the clipping plane. This option is disabled by default. Once the Draw Cell Layer option is enabled, use the Freeze Cell Layer checkbox to keep the displayed layer of cells in place while you perform additional mesh display operations.
To draw a layer of cells on the clipping plane for specific cell zones, select the cell zone(s) under Mesh Objects in the Tree and use the Draw Cell Layer option in the context menu.
- Selection Helper
Use the Selection Helper group to assist in selecting face zones, edge zones, objects, object face zones, or object edge zones by a Name Pattern and Geometry Recovery level. Select the type of zone or object using the Filter drop down list, then use the Name Pattern field to refine your selection. When selecting Face Zones in the Filter list, the Geometry Recovery option is available to further refine your selection.
The Advanced... button opens the Zone Selection Helper dialog box. Use this dialog box to expand the zone selection criteria to include the number of entities present in them, or using the minimum or maximum face zone area.
The Selection Helper options and the Zone Selection Helper dialog box may be used with all dialog boxes that contain zone or object lists (for example, Cell Zones and Boundary Zones dialog boxes).
- Mouse Probe Function
Use the Mouse Probe Function group to set the behavior of the mouse probe button.
- Select
enables the selection of a single entity based on the filter selected and also adds the selected entity to a list that can be used in most dialog boxes.
- Box
enables the selection of a group of entities within a box. To define the selection box, click the mouse probe button at one corner of the region to be selected, drag the mouse to the opposite corner, and release the mouse probe button.
- Polygon
enables the selection of a group of entities within a polygonal region. To define the selection polygon, click the mouse probe button at one vertex of the polygonal region to be selected, and use the left mouse button to successively select each of the remaining vertices.
Click the mouse probe button again (anywhere in the graphics window) to complete the polygon definition.
- Select Visible Entities
enables selection of only visible entities (nodes, faces, zones, objects) when the mouse probe function is set to Box or Polygon. The selection includes only entities visible to the eye, and not those hidden behind other entities in the display. This option is disabled by default. When enabled, ensure that the model is zoomed to an appropriate level for correct selection.
Note:If the mesh is not connected, all entities (nodes, faces, zones, objects) will be selected irrespective of whether they are visible or not.
This visual selection behavior works only on local displays and may generate warning messages when attempting selection on a remote system.
- Display
contains options to control the display in the graphics window.
- All Faces
enable or disable the display of all faces in the visible zones or objects, colored by their zone type.
- Free Faces
enable or disable the display and highlighting of free faces on the visible zones or objects. A free face is one having at least one edge not shared with a neighboring face.
- Multi Faces
enable or disable the display of multi-connected faces on the visible zones or objects, along with their nodes. A multi-connected face is a boundary face that shares an edge with more than one other face, while a multi-connected node is a node that is on a multi-connected edge (that is, an edge that is shared by more than two boundary faces).
- Face Edges
enable or disable the display of face edges in the visible zones or objects. This option works in conjunction with the All Faces option.
- Title
enable or disable the display of the caption block area below the graphic containing date, product, and contents of the display.
- Help Text
enable or disable the display of help text for tool buttons or hot-keys. Detailed help is displayed whenever a command is selected by clicking a button (or pressing a hotkey on the keyboard), and remains visible until the command is complete or another command selected.
- Highlight
enable or disable the highlighting of objects, face zone labels, volumetric regions, or cell zones selected in the tree.
- Edge Zones
enable or disable the display of edge zones comprising the objects drawn in the graphics window.
- Marked Faces
enable or disable the display of marked faces in the graphics window.
- Transparency

toggle the transparency of the selected objects/zones depending on the mode of selection set. If no object/zone is selected then the entire geometry is made transparent so that internal objects/zones are visible.
- Explode

toggle between a normal view and an exploded view of the objects in the geometry.
- Edge Zone Selection Mode

enable or disable the edge zone selection mode. This restricts selection to edge zones entities only.
- Edges

show or hide edges on selected zones and objects independent of the mode of selection. If no object/zone is selected, then the edges on the displayed zones/objects are shown/hidden.
- Examine
contains options for obtaining additional information about the selected entities.
- Centroid

prints the coordinates of the centroid of the selected face to the console.
This also works for edges and nodes.
- Distance

calculates and displays the distance between two selected locations or nodes. The tool prompts you when more selections are needed, otherwise, it uses the two most recent selections (nodes or coordinates) in the selections list.
Distances can be measured between points, edges, faces, and zones. The distance between zones is computed using the global average centroid of each zone facet to the relative zone distance. So, for calculating the distance between two planar zones, the distance would be based on the starting and ending points being located directly on the zone surfaces; whereas for calculating the distance between two curved surfaces, the distance would be based on the starting and ending points being located offset from the zone surface(s).
- Entity Information

prints detailed information about the selected entities in the message window. For more details, see Entity Information.
In addition, if a selected zone or object has been set as a target, this will toggle the identifying color.
- Centroid
- Patch Options
contains additional options applicable to the patching tools.
- Remesh
enables automatic remeshing of the patched area.
- Separate
enables you to create a separate face zone/object for the new faces created. Additional options for object/zone granularity and type are available in the Patch Options dialog box (see Using the Patch Options Dialog Box for details).
The Remesh and Separate options are enabled by default.
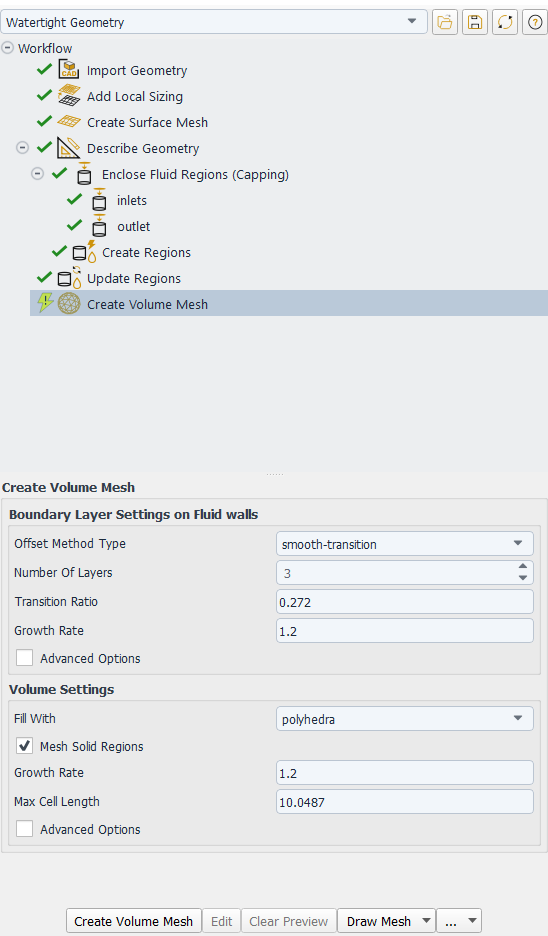
Use the Workflow tab to access guided workflow templates that can be used to streamline the use of Fluent in meshing mode. Common tasks and property settings are available to walk you through the process of generating a volume mesh for use in the Fluent solver. For instance, the Watertight Geometry guided workflow can be used to quickly generate a volume mesh from an imported watertight CAD geometry. You can also create your own workflow using the available tasks (such as, adding local sizing controls, creating a surface mesh, capping inlets and outlets, creating regions, and so on). See Getting Started with the Fluent Guided Workflows for more information.
In Mesh Generation mode, you use the Outline View tree for object-focused management of the meshing workflow and display. Branches can be expanded and collapsed as required. At each level, right-click and select from context-sensitive menus to manage the mesh generation process.
Filtering and the support of wildcards, such as *, ?, [], Boolean NOT (^), Boolean AND (&), as well as Boolean OR (|), is available at the top of the Outline View.
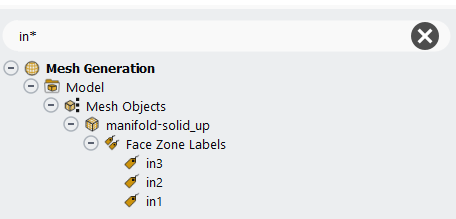
The filter text entry box allows you to search and organize a list using a text string. The text string can include wildcards and regular expressions that allow you to perform pattern matching. For example, searching *let* finds surfaces such as inlets and outlets, including those with longer names, such as "upper-inlet-5". If you have walls separated by a number, you can search example-wall-?-23, which would show example-wall-1-23, example-wall-2-23, and so on. This feature is also available in some list selection controls in various dialog boxes in Fluent Meshing. For more information, see Filtering Lists and Using Wildcards.
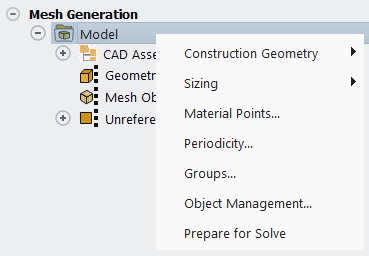
At the top of the tree, right-click Model to access controls not specific to any entity. For example, you can access dialog boxes to create new construction geometry or objects; set mesh size parameters; and manage material points, periodicity, and user-defined groups. You can also prepare the mesh for solving in solution mode.
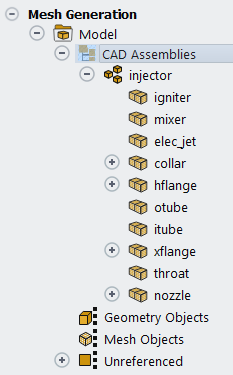
The CAD Assemblies tree is created when the Create CAD Assemblies option is selected for CAD import. It represents the CAD tree as it is presented in the CAD package in which it was created. The CAD entities in the tree are categorized as components and bodies. Components represent an assembly, sub-assembly, or part in the original CAD package, while bodies are the basic entities which include CAD zones. You can also set up labels for the CAD zones, if required.
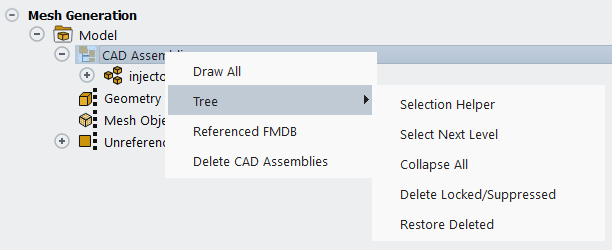
Right-click CAD Assemblies to draw or delete all imported assemblies, and obtain the referenced FMDB file locations. The Tree sub-menu contains options that control the appearance of the CAD Assemblies tree. These options can be used to select or deselect the CAD objects and zones in the tree, expand or collapse the tree branches, and also delete suppressed or locked CAD objects.
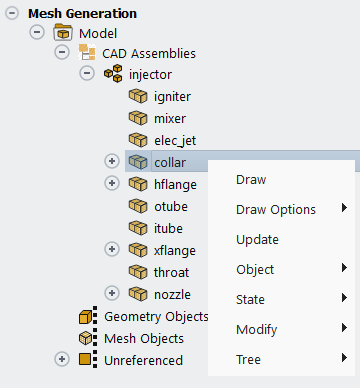
The tree menus at CAD component and body levels contain display options and options for updating the CAD entities, creating and manipulating geometry/mesh objects, setting the state and modifying the CAD entities, and tree selection options.
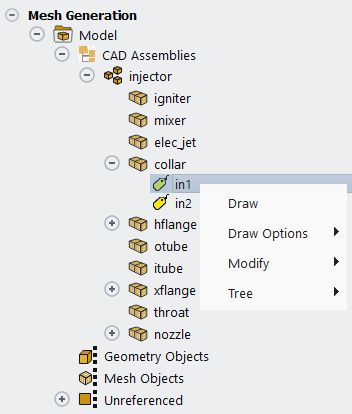
The CAD label menu contains options for deleting and renaming the labels.
For a full description of the CAD Assemblies tree menus, see CAD Assemblies.
Geometry and Mesh Objects
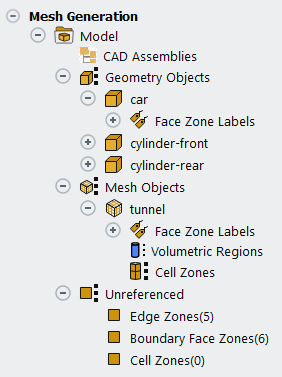
When reading a mesh file, the tree is populated with Geometry Objects and Mesh Objects, if already defined. Importing a mesh from other formats will result in the edge zones, boundary face zones, and cell zones available in the Unreferenced branch. These zones are not included in any object.
Geometry objects are created when CAD files are imported using the CAD Faceting option. The geometry objects may be non-conformal. Mesh objects are created when CAD files are imported using the CFD Surface Mesh option. The mesh objects are conformal. See Importing CAD Files for details on the CAD import options.
You can also create geometry/mesh objects from the CAD entities in the CAD Assemblies tree. CAD entities are locked when corresponding geometry or mesh objects are created. See Creating and Modifying Geometry/Mesh Objects for details.
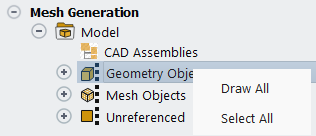
You use the Geometry Objects or Mesh Objects context-sensitive menu to perform actions on all objects in your model. At the global object level, right-click (Geometry Objects or Mesh Objects) to draw or select all the objects.
If the objects are associated with CAD entities, you can also update all or detach all objects.
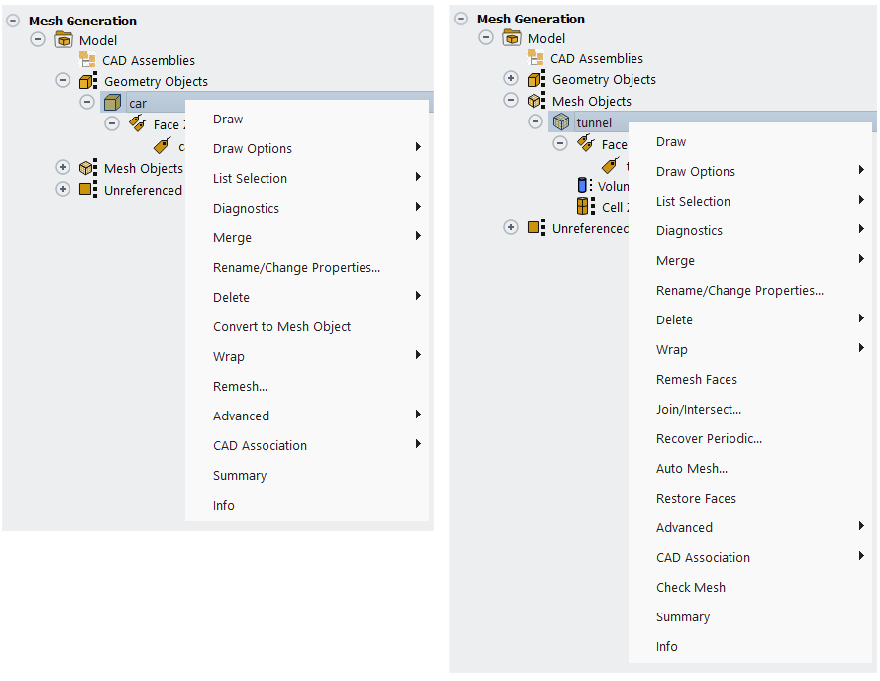
Right-clicking on an individual Object (Geometry or Mesh) name in the Outline View opens a context-sensitive menu to access object level refinement and control tasks. You can also select objects graphically, but the menus are available only when selecting in the Outline View.
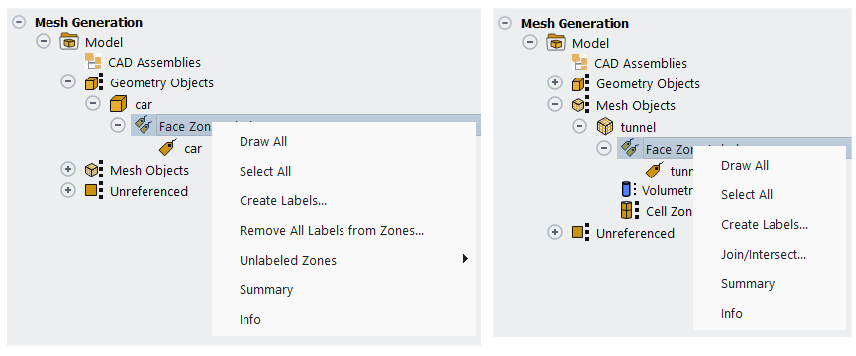
For geometry objects, Face Zone Labels are groups of face zones comprising the object. For mesh objects, these are original CAD zones or bodies, or face zones comprising the mesh object. If the mesh object is created by merging multiple mesh objects, the face zone labels represent the objects that were merged. They provide the link to the original geometry. Under Mesh Objects, Face Zone Labels form boundaries enclosing the Volumetric Regions—separate, closed, water-tight volumes. Cell Zones are regions of volume mesh.
The context-sensitive menu for Face Zone Labels contains options for drawing and selecting all labels, creating new labels, and obtaining an overall summary or detailed information about the face zone labels. For geometry objects, there are additional options to remove labels from zones and options for displaying and selecting unlabeled zones. For mesh objects, the Join/Intersect... option contains options for creating a conformal surface mesh.
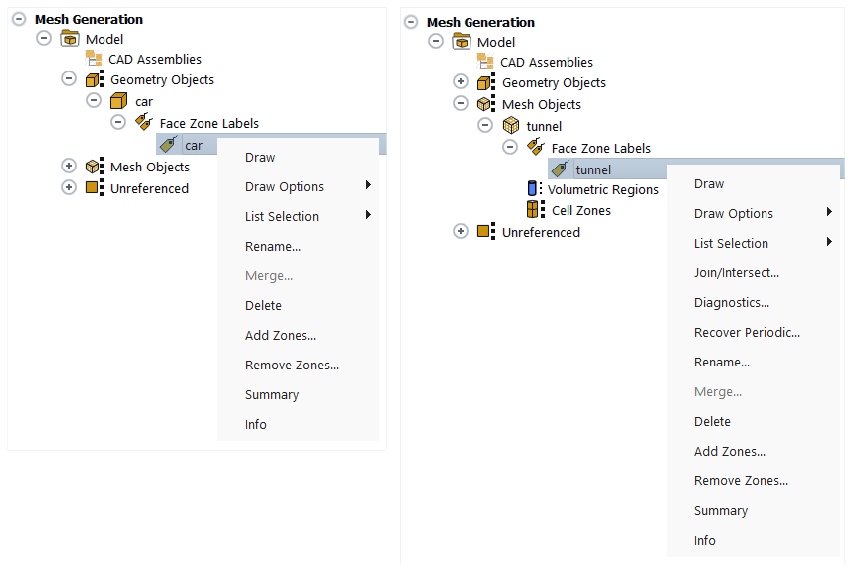
Right-clicking on a Zone Label name under geometry/mesh objects allows for zone level display and selection options, and meshing tasks.
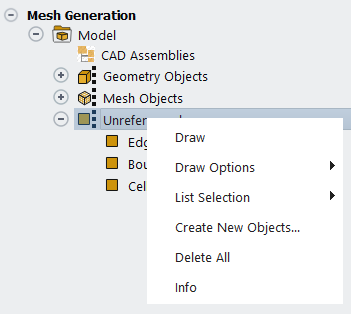
The Unreferenced menu includes the common Draw and List Selection menus as well as options to manage the unreferenced zones.
For a full description of object based meshing using the tree and context menus, refer to Surface Mesh Processes.
Note: Any dialog box opened via right-clicking in the Outline View becomes modal. That is, to preserve the active selection, the action must be completed or the dialog box closed before the tree selection can be changed.
The graphics window displays the current state of your model according to your selected Rendering, Color Scheme and Display options. See Controlling Display Options for details.
The hide ribbon button (![]() ) is used to expand the area for the graphics window by minimizing the ribbon. Click a second time to maximize the ribbon to restore the graphics window area.
) is used to expand the area for the graphics window by minimizing the ribbon. Click a second time to maximize the ribbon to restore the graphics window area.
The axis triad indicates the orientation of the model and also provides options for manipulating the orientation in the graphics window.
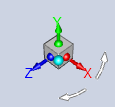
To change the orientation of the model using the triad, you can:
Click an axis/semi-sphere to orient the model in the positive/negative direction.
Right-click an axis/semi-sphere to orient the model in the negative/positive direction.
Click the cyan iso-ball to set the isometric view.
Click the white rotational arrows to perform in-plane clockwise or counterclockwise 90 degree rotations.
Left-click and hold—in the vicinity of the triad—and use the mouse to perform free rotations in any direction. Release the left mouse button to stop rotating.
You can choose how the mouse buttons interact with the graphics display using the Mouse Buttons dialog box. See Controlling the Mouse Buttons.
The search bar (upper right of the Fluent window) allows you to quickly locate the commands or controls that you are looking for. Clicking the search results is equivalent to clicking the same control in the ribbon. Hovering over a search result highlights the location of the control in the ribbon. Clicking a text command search result automatically enters the text of the command, but it does not execute the command; you still have to press Enter in the console to execute the text command.
The console is usually located below the Graphics Window, as shown in Figure 1.1: The User Interface Components. It is used to provide a text based interface to Fluent meshing.
The console will display messages relating to meshing or solution procedures. All console information is saved to memory, so you can review it at anytime by using the scroll bar on the right side of the console. The console visually indicates whether the text is an error message (red), user input (blue), or program generated output (black).
The console behaves like an "xterm" or other Linux command shell tool, or to the MS-DOS Command Prompt window. It enables you to interact with the TUI menu. For more information on the TUI, see Text User Interface in the Fluent Text Command List.
You may interrupt the program by issuing a "break" command (press Ctrl+C) while data is being processed. You cannot cancel an operation after it is complete and the program has started drawing in the graphics window.
You may perform text copy and paste operations between the console and other X Window (or Windows) applications that support copy and paste.
Note: On a Linux system, follow the steps below to copy text to the clipboard:
Drag the pointer across the text to be copied.
Move the pointer to the target window.
Press the middle mouse button to “paste” the text.
The Auto-scroll check box enables automatic scrolling of the console when new content is printed. When the Auto-scroll is disabled, the cursor stays at the last selected position. Messages will continue to be appended in the console, but the cursor will not automatically scroll to the bottom until the Auto-scroll is enabled.
Warning and Error Messages
In addition to being printed in the console, warning and error messages are also
available for easier review in separate Warning and
Error dialog boxes. These messaging dialog boxes can be
opened by clicking the warning (![]() ) and error (
) and error (![]() ) icons in the upper right of the console. When new messages are
printed in the console, the icons are highlighted (
) icons in the upper right of the console. When new messages are
printed in the console, the icons are highlighted (![]() ,
, ![]() ), indicating that there are new messages for review.
Note that clearing the messages from the Warning
and Error dialog boxes does not remove them from the
Console or transcript.
), indicating that there are new messages for review.
Note that clearing the messages from the Warning
and Error dialog boxes does not remove them from the
Console or transcript.
The user interface includes several toolbars to provide shortcuts to performing common tasks. You can enable or disable the visibility of the toolbars that appear in the graphical user interface. You can dock the toolbars around the graphics window or position them "floating" at any convenient location in the user interface.
The Standard Toolbar contains options to control the layout and to find additional resources.
Click the Ansys logo to open the Ansys home page in your default browser.
Use the options in the Arrange the workspace (
 ) menu to control the application window layout. You can also enable or disable the visibility of each interface component in this menu.
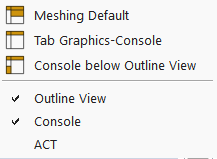
The most recent arrangement of the user interface components will be saved to a
.cxlayoutfile in your home folder. The layout will be restored the next time Ansys Fluent is opened.Note: Do not use multiple graphics windows in meshing mode.
Help (
 ) contains options for accessing the User Documentation and obtaining license usage and product version information. See Using the Help System for details.
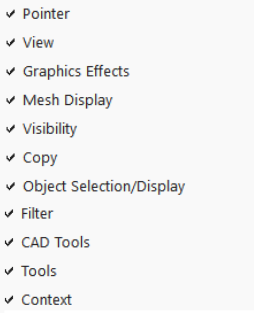
On each side of the graphics window are context-sensitive toolbars for quick access to commonly used operations. Right-click any toolbar to access the Toolbar Options to set the visibility of the respective toolbars.
You can quickly change the role of the left mouse button using the options in the Pointer Tools toolbar. See Controlling the Mouse Buttons for a description of the options.

Box Select
 lets you select surfaces by box-selecting, that is
clicking and dragging the mouse from left-to-right or right-to-left over
your model. For more information, see Controlling the Mouse Button Functions.
lets you select surfaces by box-selecting, that is
clicking and dragging the mouse from left-to-right or right-to-left over
your model. For more information, see Controlling the Mouse Button Functions.Rotate View
 assigns the mouse-rotate
function to the left mouse button.
assigns the mouse-rotate
function to the left mouse button.Pan
 assigns the mouse-dolly
function to the left mouse button.
assigns the mouse-dolly
function to the left mouse button.Zoom In/Out
 assigns the mouse-roll-zoom
function to the left mouse button.
assigns the mouse-roll-zoom
function to the left mouse button.Zoom to Area
 assigns the mouse-zoom
function to the left mouse button.
assigns the mouse-zoom
function to the left mouse button.
You can quickly change the model display using the View Tools toolbar.

 shows the 3D object on your 2D screen approximately
how your eye would see it in real life. This button is only available
when running Fluent in 3D.
shows the 3D object on your 2D screen approximately
how your eye would see it in real life. This button is only available
when running Fluent in 3D. shows 3D objects to scale, ignoring perspective
view. When enabled, it makes it so the ruler is
accurate. This button is only available when running
Fluent in 3D.
shows 3D objects to scale, ignoring perspective
view. When enabled, it makes it so the ruler is
accurate. This button is only available when running
Fluent in 3D.Note: When Orthographic is selected for Graphics view in Preferences (Appearance branch), an additional Ruler option appears. Enabling Ruler makes it so that the ruler is displayed whenever the view is changed to orthographic. You can still disable the ruler by toggling the ruler button
 ).
).Fit to Window
 adjusts the overall size of your model to take maximum advantage of the graphics window’s width and height.
Last View
 restores the display to the previous view.
Next View
 allows you to revert to the displayed objects
previous location and orientation in the graphics window.
allows you to revert to the displayed objects
previous location and orientation in the graphics window.Set view
 contains a drop-down of views, allowing you to display the model in isometric or one of six orthographic views.
You can also click on the display axes triad in the graphics window to change to one of the standard views. Use the right mouse button to reverse the orthographic view.
The graphics effects tools allow you to control which graphics effects are shown in the graphics window.

The following is a brief description of each of the graphics effects tools:
Reflections
 redisplays all hidden surfaces.
Shadows
 controls which shadowing effects are shown:
Static Shadows
 is the shadow of the model on the ground
plane.
is the shadow of the model on the ground
plane.Dynamic Shadows
 is the shadow of the model on itself. These
shadows are updated as the model is rotated. This
graphics effect may result in reduced graphics
performance.
is the shadow of the model on itself. These
shadows are updated as the model is rotated. This
graphics effect may result in reduced graphics
performance.
Grid Plane
 shows/hides the ground plane grid that is displayed
beneath the model.
shows/hides the ground plane grid that is displayed
beneath the model.
The mesh display configuration options contains predefined settings for how a mesh and objects are displayed.

The following is a brief description of the mesh display tools:
Mesh Display
 opens the Mesh Display Dialog Box.
Front Faces Transparent
 makes the front faces of the displayed object
transparent, allowing you to see inside.
makes the front faces of the displayed object
transparent, allowing you to see inside.
There are visibility options available when working in the graphics window:

Axes Visibility
 turns the axes display on and off.
Ruler Visibility
turns the ruler on and off. When enabled, it
switches the view to orthographic (if it was
previously set to perspective).Titles Visibility
 turns the titles display on and off.
Boundary Markers
 enables/disables boundary markers at inlets and
outlets when the mesh is displayed.
enables/disables boundary markers at inlets and
outlets when the mesh is displayed. Note: This feature is not available in Meshing mode.
The copy tools allow you to copy an image of the graphics window to the clipboard and capture an image of the graphics window.
The following is a brief description of each of the copy tools:
Copy to Clipboard
 copies the current picture displayed in the
selected graphics window tab onto your clipboard.
copies the current picture displayed in the
selected graphics window tab onto your clipboard.Save Picture
 captures an image of the active graphics window.
For more information, see Saving Picture Files.
captures an image of the active graphics window.
For more information, see Saving Picture Files.
The object selection/display tools allow you to modify the selection and display of objects in the graphics window.

The following is a brief description of each of the object selection/display tools:
Deselect the Currently Selected Surfaces
 deselects the currently-selected surfaces in the
graphics window.
deselects the currently-selected surfaces in the
graphics window.
Other object selection/display tools are available within Fluent Meshing, such as the following options within the Isolate toolbar:
Show All
 redisplays all hidden surfaces.
Hide Selected Surfaces
 hides the selected surfaces from the
display.
hides the selected surfaces from the
display.
Use the Filter toolbar to set the entity type that the mouse probe filter will recognize. See Controlling the Mouse Probe Function.
The selection filters available in the toolbar are Position, Node, Edge, Zone, and Object. You can also set the mouse probe to Draw Sizes and examine the mesh size at the probe point.
The toolbar also contains options for selecting visible entities based on the filter set, deselecting the last entity, and clearing all selections.
Use the CAD Toolbar to access tools for manipulating CAD entities and creating/managing labels and geometry/mesh objects associated with the CAD entities. This toolbar is available only when the CAD entities are displayed in the graphics window.
See CAD Assemblies for details.


Use the Tools toolbar to access options for constructing geometry primitives or loop selection tools. You can also use the Isolate tools to isolate selected zones/objects in the display or limit the display to zones/objects based on area/curvature of the selected zones/objects.
Use the Context toolbar to see context-sensitive options based on the entities selected. When entities are selected with the mouse probe, this toolbar changes to represent the tasks and processes applicable to the selected entities, as a subset of all tasks and processes used to generate a mesh.
An example is shown below. Descriptions of available tools are compiled in Shortcut Key Actions.
![]()
The ACT Start Page is available when ACT functionality is enabled in Fluent. To enable ACT functionality, use one of these options:
Enable Load ACT in the Fluent Launcher.
Select ACT from the Arrange the workspace (
) menu.Use the command:
/file/load-act-tool.
The ACT Start Page provides an access point for Ansys ACT functionality in Fluent. From this page, you can access tools that can be used in the development and execution of extensions. For more information, see ACT Tools in the ANSYS ACT Developer's Guide.
For information on creating target product wizards for Fluent, see the ACT Customization Guide for Fluent.
You may want to customize the graphical user interface by changing the way that the various elements are arranged. This can be achieved by "dragging" elements and "dropping" them at a new location. For example, the graphics window can be tabbed on top of the console, or the console can be moved below the tree. In meshing mode, you can move the console and the toolbars.
To restore items that you intentionally or unintentionally closed, right-click the top
toolbar to restore those items. You can also click ![]() to select one of the predefined
layouts and restore missing items.
to select one of the predefined
layouts and restore missing items.
You may also want to customize the graphical user interface by changing attributes such as text color, background color, and text fonts. The program will try to provide default text fonts that are satisfactory for your platform's display size, but in some cases customization may be necessary if the default text fonts make the GUI too small or too large on your display, or if the default colors are undesirable.
The GUI in Fluent is based on the Qt Toolkit. If you
are unfamiliar with the Qt Toolkit, refer to any
documentation you may have that describes how to use the Qt
Toolkit or application. The graphical attributes can be modified in a Qt
stylesheet file named cxdisplay.qss and placed in your home
directory.
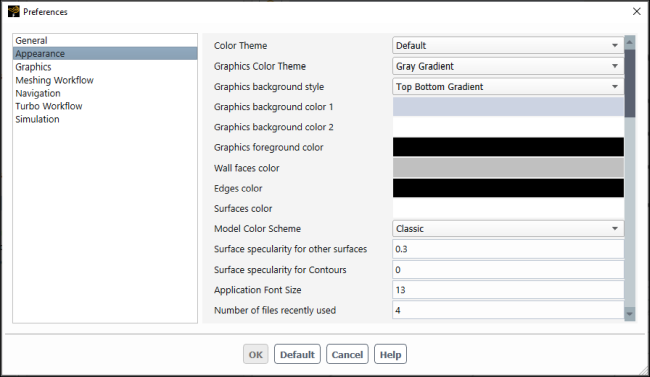
You can specify global settings that are applied whenever you are operating in Ansys Fluent. These settings are case-independent and are controlled using the Preferences dialog box.
To review and modify your preferences, open the Preferences dialog box by selecting Preferences... from the File menu.
![]() File
→ Preferences...
File
→ Preferences...
Note:
Some settings, such as ruler and axis visibility can also be controlled locally within a Fluent session (that is, outside of the Preferences dialog box). Settings that deviate from the global settings specified in the Preferences dialog box will not be retained beyond the current session.
If you change a setting locally that is also controlled by Preferences, the local change will be shown for this session only. If you open the Preferences dialog box and click in an attempt to overwrite the local settings change, the global setting will only appear if it is a change from how the setting is already specified globally. For example, if you have Ansys Logo set as Black in Preferences, then you change the logo to White in the Display Options dialog box, the logo will change from black to white. If you then re-open the Preferences dialog box and click , the logo will remain white, even though it is specified as Black in the preferences dialog box. The reason being that globally, the logo is already specified as black, so clicking does not change the current global color of the logo, which is being overruled by your local change to white.
Not all preference settings apply in all workspaces. For example, the Flow Model option in the General branch only applies to the Solution workspace and Meshing Workflow settings only apply to the meshing workflows in the Meshing workspace.
The controlling preferences file location is:
Windows:
%HOMEDRIVE%\%HOMEPATH%\.fluentconf\24.2.0\preferencesLinux:
%HOMEPATH%/.fluentconf/24.2.0/preferences
If no preference file is found (for instance, after installation of a new version or deletion of the preference file), Fluent will attempt to load user preferences from a previous version. If no previous version's preferences are found, Fluent will create a new file using the default settings.
At any time, you can revert your preferences to the default settings by clicking the button in the Preferences dialog box. Or you can delete the preferences file and Fluent will follow the above rule to create a new one.
Fluent includes an integrated help system that provides an easy access to the documentation. Using the graphical user interface, you can access the entire User's Guide and other documentation. The User's Guide and other manuals are displayed in the Ansys Help, which enables you to use the hypertext links and the browser's search and navigation tools to find the information you need.
There are many ways to access the information contained in the online help:
You can get reference information from the main window or any dialog box by clicking .
You can go to the contents page for the Meshing section of the User's Guide and use the hypertext links there to find the information you are looking for. Select > .
To find information about text interface commands, you can either go to the Meshing section of the Fluent Text Command List in the Ansys Help, or use the text interface help system described in Text User Interface in the Fluent Text Command List.
If you are running with an existing Fluent license (FluentLM), you can obtain a listing of current Fluent users in the console by selecting > .
If your installation of Fluent is managed by the Ansys License Manager (ANSLIC_ADMIN), you will see a message that will indicate that licensing is managed by ANSLIC_ADMIN. For additional information on licensing information, refer to the Installation and Licensing Documentation in the ANSYS Help.
Scroll down to the Installation and Licensing Documentation item in the left pane of the viewer.
Expand this document by clicking on the icon to the left of the document title.
Use the hyperlinks in the main viewer window to find the desired information, or, expand the items in the left pane of the viewer and scroll to the topic of interest.