


The following sections explain how to examine the mesh visually as well as manipulate the graphics display and mouse function. You can specify various parameters that affect how the mesh appears in the graphics window, manipulate the lighting and create composite views, control the display environment, modify the mouse button functions, and set program control variables.
You can manipulate the display of mesh entities and modify the way they appear in the graphics window. Options exist for drawing and selecting the entities at your choice of complexity (object, zone, face, edge, node). Tools exist for setting colors or highlighting based on specific parameters such as free or multiply-connected, size field, or geometry recovery. You can also manipulate the display to show a cross-section, adjust lighting, or overlay multiple images.
The most commonly used mesh display tools are easily accessible in the graphical user interface ribbon. For more flexibility and advanced display controls, see Generating the Mesh Display Using the Display Grid Dialog Box.
In the Model tree, select the objects to be displayed using the right mouse button. At the global Geometry Objects or Mesh Objects level, you can choose to Draw All. At the individual object level, the Draw menu item allows you to draw the selected object exclusively, or use the Draw Options menu to Add to or Remove from the existing display, as well as Highlight or Select the object.
In the meshing mode ribbon, there are groups of tools to interactively crop the display of the mesh, to assist in selecting zones or objects, or to modify how the model is displayed in the graphics window.
You can use the Bounds group to limit the display to within a specified distance of a selected entity.
Select an entity (node, edge, face, zone) and specify a Delta value. The Set Ranges and Reset buttons affect all directions simultaneously, or enable and disable the directions individually. Enable Cutplanes to limit the graphics display to within delta value of the selected entity in the selected ranges.
Tip: The settings in the Bounds group are also available when examining the volume mesh. The > dialog box has a Bounded check box on the Cells tab, and the Cell Zones context menu includes an option to display the cells in the specified range.
You can use the Clipping Planes group to interactively crop the display in one direction and pan the cropped view as necessary.
Enable Insert Clipping Planes and use the slider to adjust the viewing limits. You can use the Flip and Limit in options to further manipulate the position and direction of the clipping plane.
If you want to select and view only certain types of cells, use the Display Grid dialog box and select the desired cell Types that you want to view and click Apply. Any subsequent update of the clip plane view would be based on the selections made in the Display Grid dialog box.
You can also use the Show Cut Edges option to display the cut edges of the model exposed by the clipping plane. This option is disabled by default.
Enable the Draw Cell Layer option in order to quickly visualize a layer of cells of the volume mesh on the clipping plane. Once the Draw Cell Layer option is enabled, you can enable the Freeze Cell Layer option in order to keep the displayed cell layer in place as you continue to study the mesh using other tools.
To draw a layer of cells on the clipping plane for specific cell zones, select the cell zone(s) under Mesh Objects in the Tree and use the Draw Cell Layer option in the context menu.
Note: Your settings in the Clipping Planes ribbon group also work in conjunction with specified ranges in the Bounds ribbon group, such that your bounds selections and range settings are respected when interacting with the clipping plane.
You can use the Selection Helper group to assist in selecting zones or objects by a Name Pattern (wild cards accepted) and Geometry Recovery level.
Use the Filter drop down to specify face zones, edge zones, objects, object face zones or object edge zones for selection. The Advanced button opens a dialog box offering more options for zone selection.
You can use the Selection group to choose how to select entities using the mouse in the graphics display.
The Global Display group contains several check boxes to enable or disable certain elements of the graphics window (Title, Help Text) or model display (Faces, Edges, Highlights).
The Local Display group contains several tools to help with visualizing the current model. These include Transparency, Exploded view, Centroid, Edge Zone selection mode, Face edge display and Measure Distance.
Several on-screen tool buttons have associated hot-keys. A complete list is available in Shortcut Key Actions.
The Display Grid dialog box includes a full set of tools to control the display of items using several criteria.
To generate the mesh display:
Select > .
Select the entities to be displayed in the Zones lists in the Nodes, Edges, Faces, or Cells tabs. You can also select several entities of the same group using the Zone Groups lists in these tabs.
Select the display Options as appropriate from the group box in the Nodes, Edges, Faces, or Cells tabs.
You may select intrinsic parameters such as skewness or size. When you specify a range for a particular parameter, the entities that satisfy that condition are displayed. If more than one range limitation is specified, then only those entities that match all specified range limitations are drawn.
Select the display Types as appropriate from the group box in the Faces or Cells tabs.
You can select Tri, Quad, and/or Poly face types. In addition, you can select Tet, Hex, Pyramid, Wedge, Hex-Prism, and/or Poly-Prism cell types.
The Bounds tab offers enhanced functionality relative to the ribbon group.
You may insert up to six cutplanes (two in each of the x-, y-, and z-direction) and asymmetrically control their location based on specific coordinates. Alternatively, you can compute ranges based on the proximity to a selected entity.
Set the display options as appropriate in the Attributes tab. See Mesh Display Attributes
You can specify information regarding color, display of solid (filled) faces, and shrinkage of faces and cells. These features can help you visualize your mesh effectively and quickly determine the cause of any problems in the mesh.
Click to draw the mesh in the active graphics window.
To cancel a display operation, press Ctrl+C while the data is being processed in preparation for graphical display. You cannot cancel the operation after the program begins to draw in the graphics window.
The mesh display options include modifying the mesh colors, adding the outline of important features to a display, displaying normals, shrinking the faces and/or cells in the display, adding lights for filled mesh displays, and so on.
Modifying the Mesh Colors
You can control the colors used to render the mesh for each zone type or entity. You can modify the colors using the Grid Colors dialog box.
To open the Grid Colors dialog box, go to the Attributes tab in the Display Grid dialog box, and click .
By default, the By Type coloring option is selected, enabling you to assign colors based on zone type.
To change the color assigned to a particular zone type, select the zone type in the Types list.
Select the required color in the Colors list.
If you prefer to assign colors based on the zone ID, select the By Surface option.
Select By Normal to color one side of the faces in grey and the other side in yellow, depending on the normal direction. The side colored grey indicates normal direction (normals pointing toward you), while the side colored yellow has normals pointing away.
Important: You can set colors individually for the mesh displayed on each of the zones using the Scene Description dialog box.
Adding Features to an Outline Display
For closed 3D geometries, the standard outline display may not show sufficient details to accurately depict the shape. This is because for each boundary, only the edges on the outside of the geometry (that is, those used by only one face on the boundary) are drawn. You can capture additional features using the Feature option in the Display Grid dialog box. Specify an appropriate value for the Feature Angle to obtain the outline display required.
Shrinking Faces and Cells in the Display
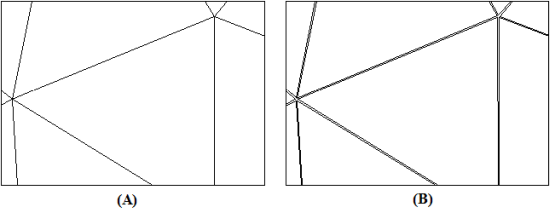
To distinguish individual faces or cells in the display, you may want to enlarge the space between adjacent faces or cells by increasing the Shrink Factor in the Display Grid dialog box. The default value of zero produces a display in which the adjacent faces or cells overlap. A value of 1 creates the opposite extreme, where each face or cell is represented by a point and there is a considerable space between entities. A small value such as 0.01 may be sufficient to enable you to distinguish a face or cell from its neighbor. Figure 6.9: Mesh Display (A) With Shrink Factor = 0 (B) With Shrink Factor = 0.01 shows displays with different Shrink Factor values.
Adding Lights
You can add lights with a specified color and direction to your display. These lights can enhance the appearance of the display, especially for 3D geometries.
Use the Display Options dialog box to enable lighting effects. Lights On is enabled by default with the Automatic lighting method. The Automatic lighting method automatically selects the best lighting method for the current display in the graphics window. You may disable Lights On or select an alternate method from the Lighting drop-down list. Flat is the most basic method: there is no interpolation within the individual polygonal facets. Gouraud and Phong have smoother gradations of color because they interpolate on each facet.
The Lights dialog box contains options for creating lights and then enabling/disabling individual lights as needed. In this way, you can retain lights that you have defined previously but do not want to use at present.
The default light, light 0 is defined to be dark gray with a direction of (1,1,1). To define additional lights, do the following:
Increase Light ID to a new value (for example, 1).
Enable Light On.
Define the light color by entering a descriptive string (for example,
lavender) in the Color field, or by moving the Red, Green, and Blue sliders to obtain the desired color. The default color for all lights is dark gray.Specify the light direction by doing one of the following:
Enter the (X, Y, Z) Cartesian components under Direction.
Click the middle mouse button in the desired location on the sphere under Active Lights. (You can also move the light along the circles on the surface of the sphere by dragging the mouse while holding down the middle button.) You can rotate the sphere by pressing the left mouse button and moving the mouse (like a trackball).
Use your mouse to change the view in the graphics window so that your position in reference to the geometry is the position from which you would like a light to shine. Then click Use View Vector to update the X,Y,Z fields with the appropriate values for your current position and update the graphics display with the new light direction. This method is convenient if you know where you want a light to be, but you are not sure of the exact direction vector.
Repeat steps 1–4 to add more lights.
When the lights have been defined, click in the Lights dialog box to save the definitions.
To remove a light, enter the ID number of the light to be removed in the Light ID field and then clear the Light On check box. When a light is disabled, its definition is retained, so you can easily add it to the display again at a later time by selecting the Light On check box.
If you have made changes to the light definitions, but you have not yet clicked , you can reset the lights by clicking . All lighting characteristics will revert to the last saved state (that is, the lighting that was in effect the last time you opened the dialog box or clicked on ).
Using Styles
The Style Attributes dialog box is opened by clicking on the button in the Attributes tab frame of the Display Grid dialog box. It controls the appearance of faces, edges, and nodes that are displayed using the Display Grid dialog box. To modify the attributes of a certain type of face, edge, or node (for example, unmeshed), select the appropriate item in the Styles list, change the parameters, and click . You will see the effect of these changes the next time you display the grid.
Table 6.1: Default Style Attributes
|
Styles |
Faces Visible |
Edges Color |
Nodes Visible |
Color |
Weight |
Visible |
Color |
Symbol |
Size |
|---|---|---|---|---|---|---|---|---|---|
|
left-handed |
yes |
red |
yes |
red |
2 |
yes |
red |
o |
0.5 |
|
refine |
yes |
magenta |
yes |
yellow |
2 |
yes |
magenta |
o |
0.5 |
|
free |
yes |
cyan |
yes |
foreground |
2 |
yes |
orange |
o |
0.5 |
|
multi |
yes |
yellow |
yes |
foreground |
2 |
yes |
magenta |
o |
0.5 |
|
unmeshed |
no |
– |
yes |
orange |
2 |
yes |
red |
o |
0.5 |
|
unused |
no |
– |
yes |
green |
2 |
yes |
green |
x |
0.5 |
|
mark |
yes |
magenta |
yes |
yellow |
2 |
yes |
magenta |
o |
0.5 |
|
tag |
yes |
magenta |
yes |
yellow |
2 |
yes |
magenta |
o |
0.5 |
|
face-size |
yes |
blue |
yes |
foreground |
1 |
no |
– |
– |
– |
|
cell-size |
no |
– |
yes |
red |
1 |
no |
– |
– |
– |
|
face-quality |
yes |
red |
yes |
foreground |
1 |
no |
– |
– |
– |
|
cell-quality |
no |
– |
yes |
red |
1 |
no |
– |
– |
– |
The Display Options dialog box contains options for changing some of the rendering parameters for the mesh displayed in the graphics window. You can also control the lighting attributes in a scene or modify parameters based on the graphics hardware and software you are using or change the graphics window layout or color scheme. After making a change to any of the parameters, click to update the active graphics window with the new attributes.
>
Rendering
The following Rendering options are available:
- Line Width
Use this control to increase the width from the default value of 1 pixel.
- Point Symbol
The default symbol is a + sign inside a circle. Selecting a different symbol in the Point Symbol drop-down list may help visibility in some situations.
- Animation Options
There are two animation options that you can choose from:
- All
uses a solid-tone shading representation of all geometry during mouse manipulation.
- Wireframe
uses a wireframe representation of all geometry during mouse manipulation. If your computer has a graphics accelerator, you may not want to use this option; otherwise, the mouse manipulation may be very slow.
- Double Buffering
Enabling the Double Buffering option can dramatically reduce screen flicker during graphics updates. Note, however, that if your display hardware does not support double buffering and you turn this option on, double buffering will be done in software. Software double buffering uses extra memory.
- Front Faces Transparent
This option enables you to turn off the display of outward pointing faces of shells or meshes. This is sometimes useful for displaying both sides of a slit wall. By default, when you display a slit wall, one side will “bleed” through to the other. When you enable the Front Faces Transparent option, the display of a slit wall will show each side distinctly as you rotate the display. This option can also be useful for displaying two-sided walls (that is, walls with fluid or solid cells on both sides). Please note, however, that enabling it can also hides some unintended surfaces on certain viewing angles, e.g. while displaying Contours, it might be visible only from one side of the surface and not from the other
- Hidden Surface Removal
If you use hidden surface removal, ANSYS Fluent will try to determine which surfaces in the display are behind others. If you do not use hidden surface removal, all surfaces will be displayed, and a cluttered display will result for most 3D mesh displays.
You can choose one of the following methods for performing hidden surface removal in the Hidden Surface Method drop-down list. These options vary in speed and quality, depending on the device you are using.
- Hardware Z-buffer
is the fastest method if supported by your hardware. The accuracy and speed of this method is hardware dependent.
- Painters
will show fewer edge-aliasing effects than hardware-z-buffer. This method is often used instead of software-z-buffer when memory is limited.
- Software Z-buffer
is the fastest of the accurate software methods available (especially for complex scenes), but it is memory intensive.
- Z-sort only
is a fast software method, but it is not as accurate as software-z-buffer.
Color Scheme
Choose the background color — gradient (Workbench) or solid black (Classic).
Layout
Choose to enable or disable additional display status information:
Titles: caption block area below the graphic containing date, product, and contents of the display. The caption block supports limited text editing. Position the cursor at the end of a line to add or delete text. Text in the caption block will not be deleted when you clear Annotations.
Axes: X-Y-Z triad showing orientation. Click on the tip of one axis to rotate the model to the selected orthogonal view, or the cyan-colored dot for isometric view.
Scale Ruler: Visual indicator showing the size in the plane of the graphics display. The indicator automatically resizes as the model is zoomed in the graphics display.
Logo: Ansys and version number.
Colormap: when displaying simulation results, the scale may be shown as function of the visible spectrum.
Graphics Device Information
If you need to know which graphics driver you are using and what graphics hardware it recognizes, you can click in the Display Options dialog box. The graphics device information will be printed in the text window.
Note: When working remotely, you can optimize the graphics window settings using the text
command remote-display-defaults. Restore the settings for your
local display using the text command
native-display-defaults.
You can use the Views dialog box to control the model orientation and zoom level in the graphics window.
>
You can choose isometric or one of the standard orthographic views from the list. The displayed model will be centered and zoomed to fit the available graphics window.
You can also use the Set view shortcut (
 ) in the View Tools to set one of the standard views.
You can modify the view by scaling, centering, or rotating the model. You can Save a modified view or Delete any view from the list.
You can use Write... to open the Write Views dialog box to save selected views to a file, which you can Read... and use with other mesh files.
You can use the Mirror Planes dialog box to define a symmetry plane for a non-symmetric domain for use with graphics. Click to open the dialog box.
In the Plane Equation group box, specify the coefficients of A, B, C, and the distance from the origin.
The equation for the mirror plane will be Ax+By+Cz=distance.
Click .
The Mirror Planes list contains a list of all mirror planes you have defined (but not the mirror planes that exist in the domain due to symmetry as they cannot be modified).
Select a mirror plane from the list. Click to see both the original and the mirrored image in the graphics window.
You can use the Camera Parameters dialog box to control perspective and modify the “camera” through which you are viewing the graphics display instead of translating, rotating, and zooming the display.
You can choose to display a perspective view of the graphics (default) or an orthographic view. Select the appropriate option in the Projection drop-down list in the Camera Parameters dialog box..
The Camera is defined by four parameters (see Figure 6.10: Camera Definition):
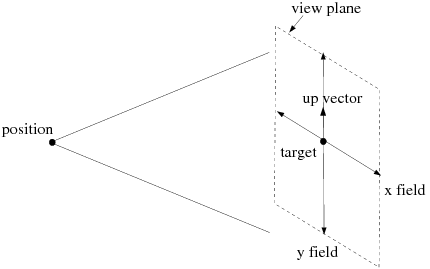
Position is the camera’s location.
Target is the location of the point the camera is looking at.
Up Vector indicates to the camera which way is up.
Field indicates the field of view (width and height) of the display.
Select the parameter to be modified and specify the coordinates or field distances in the X, Y, and Z fields. Click after you change each camera parameter.
Important: When using the sliders and dial to manipulate the view, select All in the Display Options dialog box so that you can watch the display move interactively while you move the slider or the dial indicator.
After displaying the mesh or parts of the mesh in your graphics window, you may want to overlay an additional display or move entities around and change their characteristics to increase the effectiveness of the scene displayed.
>
You can use the Scene Description dialog box—and the Display Properties dialog box and the Transformations dialog box that are opened from it—to rotate, translate, and scale each entity individually, as well as to change the color and visibility of each entity. You can make geometric entities visible and invisible, thereby adding or deleting entities from the scene one at a time.
To enhance the scene in the graphics window, you can change the color, visibility, and other display properties of each geometric entity in the scene using the options available in the Display Properties dialog box.
You can specify different colors for displaying the edges and faces of a zone to show the underlying mesh (edges) when the faces are filled and shaded.
You can also make a selected entity temporarily invisible. If, for example, you are displaying the entire mesh for a complicated problem, you can make entities visible or invisible to display only certain boundary zones of the grid without regenerating the grid display using the Display Grid dialog box.
You can also use the visibility controls to manipulate geometric entities for efficient graphics display.
For details, refer to Using the Scene Description Dialog Box.
When composing a scene in your graphics window, it is helpful to move a particular entity from its original position or to increase or decrease its size. For example, you may want to temporarily move an interior portion of the mesh outside the mesh boundaries where it can be seen and interpreted more easily.
You can also move an entity by rotating it about a specified point. If you want to display one entity more prominently than the others, you can scale its size. All these capabilities are available in the Transformations dialog box.
You can optionally add a bounding frame to the display of the domain and include measure markings to indicate the length, height, and/or width of the domain using the Bounding Frame dialog box.
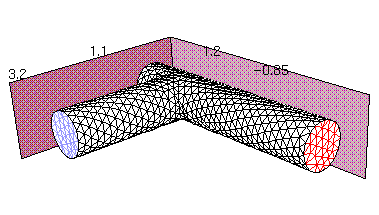
To add a bounding frame to the display:
Click in the Scene Description dialog box.
Select Domain or Display in the Frame Extents list to indicate whether the bounding frame should encompass the domain extents or only the portion of the domain that is shown in the display.
Indicate the bounding plane(s) to be displayed by clicking on the white square on the appropriate plane of the box shown under the Axes heading. You can use any of the mouse buttons. The square will turn red to indicate that the associated bounding plane will be displayed in the graphics window.
Specify where you would like to see the measurement annotations by clicking on the appropriate edge of the box. The edge will turn red to indicate that the markings will be displayed along that edge of the displayed geometry
Click to update the display with the current settings.
If you want to include the bounding frame in all subsequent displays, enable the Draw Frame option in the Scene Description Dialog Box and click . If this option is not enabled, the bounding box will appear only in the current display; it will not be redisplayed when you generate a new display (unless you have overlays enabled).
You can use the Scene Description dialog box and its associated dialog boxes as follows:
Select the mesh entities in the Names selection list in the Scene Description dialog box.
The Names list is a list of the mesh entities that currently exist in the scene (including those that are presently invisible). If you select more than one entity, any operation (color specification, transformation, and so on) will apply to all the selected entities. You can also select the entities by clicking them in the graphics window using the mouse probe button (right mouse button, by default).
Set the color, visibility, and other display properties for the mesh entities selected using the Display Properties dialog box.
You can specify different colors for individual mesh entities. You can specify different colors for displaying the edges and faces of a zone to show the underlying mesh (edges) when the faces of the grid are filled and shaded.
To modify the color of faces, edges, or lines, choose face-color, edge-color, line-color, or node-color in the Color drop-down list. The Red, Green, and Blue color scales will show the RGB components of the face, edge or line color, which you can modify by moving the sliders on the color scales. When you are satisfied with the color specification, click Apply to save it and update the display.
You can control the visibility of individual mesh entities using the Visible option. Hence, you can make an entity visible or invisible to display only certain boundary zones, without regenerating the entire mesh display.
To enable the effect of lighting for the selected entities on or off, select Lighting. You can choose to have lighting affect only certain entities instead of all of them.
To toggle the filled display of faces for the selected zones, use the Faces option. Enabling Faces on here has the same effect as turning it on for the entire mesh in the Display Grid dialog box.
To enable the display of outer edges, use the Outer Faces option. This option is useful for displaying both sides of a slit wall. By default, when you display a slit wall, one side will “bleed” through to the other. When you disable the Outer Faces option, the display of a slit wall will show each side distinctly as you rotate the display. This option can also be useful for displaying two-sided walls (that is, walls with fluid or solid cells on both sides).
To enable/disable the display of interior and exterior edges of the zones, select Edges.
To enable/disable the display of the outline of the zones, select Perimeter Edges.
To enable/disable the display of feature lines, select Feature Edges.
To enable/disable the display of the lines, select Lines.
To enable/disable the display of nodes, select Nodes.
To overlay one display over another, select the mesh entities in the Names selection list, enable Overlays in the Scene Composition group box and click . Once overlaying is enabled, subsequent graphics that you generate will be displayed on top of the existing display in the active graphics window. To generate a plot without overlays, you must disable the Overlays option and click .
Note: To overlay bounded cell zones over face zones in the display, do the following:
Display only the bounded cell zones (face zones should not be selected).
Select the cell zones in the Names selection list in the Scene Description dialog box, enable Overlays and click .
Display the face zones with the appropriate bounds specified.
If you select the bounded face zones first and enable Overlays, you will need to deselect the face zones in the Display Grid dialog box before displaying the bounded cell zones.
To transform the entities displayed, select the mesh entities in the Names selection list in the Scene Description dialog box and click to open the Transformations dialog box for the selected entities.
To translate the selected entities, enter the translation distance in each direction in the X, Y, and Z real number fields under Translate.
To rotate the selected entities, enter the number of degrees by which to rotate about each axis in the X, Y, and Z integer number fields under Rotate By. You can enter any value between -360 and 360. By default, the rotation origin will be (0,0,0). If you want to spin an entity about its own origin, or about some other point, specify the X, Y, and Z coordinates of that point under Rotate About.
To scale the selected entities, enter the amount by which to scale in each direction in the X, Y, and Z real number fields under Scale. To avoid distortion of the shape, be sure to specify the same value for all three entries.
A convenient feature of Ansys Fluent is that it lets you assign a specific function to each of the mouse buttons. According to your specifications, clicking a mouse button in the graphics window will cause the appropriate action to be taken. These functions apply only to the graphics windows; they behave differently when an XY plot or histogram is displayed. For information about the use of mouse buttons in these plots, see Plot Types. Clicking any mouse button in a graphics window will make that window the active window.
You can control mouse button mappings using the Navigation branch in Preferences, accessed by clicking Preferences... under the File ribbon tab.
![]() File → Preferences...
File → Preferences...
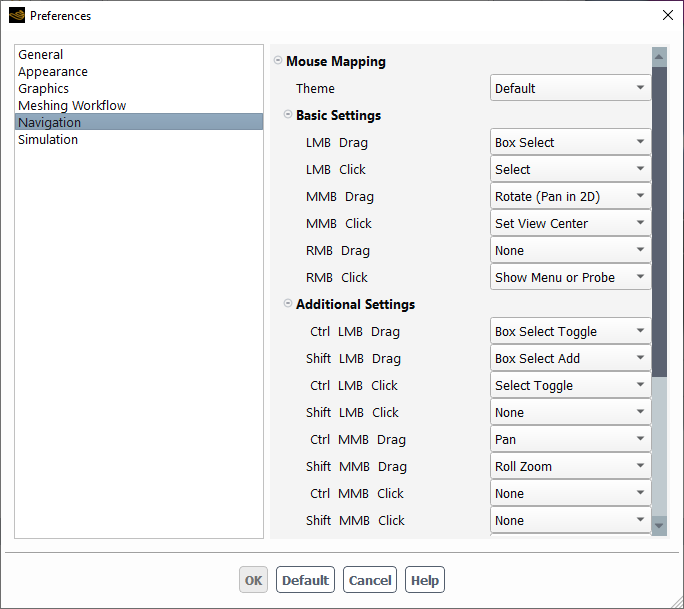
The Theme category allows you to choose from multiple predefined mouse assignments. It will change to the Custom theme once you make changes to the mouse actions.
The available button functions available are listed below:
- Box Select
Dragging from left to right selects the surfaces and volumes that are completely enclosed within the box. Dragging from right to left selects any surface or volume that is in contact with the box.
- Box Select Add
Dragging from left to right selects the surfaces and volumes that are completely enclosed within the box. Dragging from right to left selects any surface or volume that is in contact with the box. Each selection is added to the previous, not replaced.
- Box Select Toggle
Dragging from left to right selects the surfaces and volumes that are completely enclosed within the box. Dragging from right to left selects any surface or volume that is in contact with the box. If you box select over a surface that is already selected, it will be de-selected.
- Pan
Enables you to translate the view by dragging the mouse while holding down the button. The function completes when the mouse button is released or the cursor leaves the graphics window.
- Probe
Enables you to select items from the graphics windows and request information about displayed scenes. If you have selected short description from the Probe drop-down list and then click the mouse-probe button in the graphics window, only the identity of the item you clicked will be printed out in the console; if you have selected long description instead, more detailed information about a selected item will be displayed.
For additional information on probe functionality, refer to Controlling the Mouse Probe Function.
- Roll-Zoom
Enables you to rotate or zoom the view, depending on which direction you drag the mouse. If you drag the mouse horizontally, the display will rotate about the axis normal to the screen. If you drag it vertically, the display will be magnified (if you drag it down) or shrunk (if you drag it up). The function completes when the mouse button is released or the cursor leaves the graphics window.
- Rotate (Pan in 2D)
Enables you to rotate the view by dragging the mouse across the screen. Dragging horizontally rotates the object about the screen’s
 -axis; vertical mouse movement rotates the object about the
screen’s
-axis; vertical mouse movement rotates the object about the
screen’s  -axis. The function completes when the mouse button is released or
the cursor leaves the graphics window.
-axis. The function completes when the mouse button is released or
the cursor leaves the graphics window.- Set View Center
Moves the selected point to the center of the graphics window.
- Zoom
Enables you to draw a zoom box, anchored at the point at which the button was pressed, by dragging the mouse with the button held down. When you release the button, if the dragging was from left to right, a magnified view of the area within the zoom box will fill the window. If the dragging was from right to left, the area of the window is shrunk to fit into the zoom box, resulting in a “zoomed out” view.
Note: Use Esc to deselect all surfaces in the graphics window.
Important: 3Dconnexion Space products (Mouse, Pilot, and Navigator) are not supported with Ansys Fluent.
Note: The following are known issues concerning Fluent mouse button behaviors in meshing mode that differ from those found in solution mode:
Context menus are not available in the graphics window, so the corresponding options (Show Menu and Show Menu or Probe) options only apply to solution mode.
While the Probe function provides surface information in the console window, it also acts as a Select Toggle where objects can be selected and deselected. In addition, while the Select function allows you to select objects, it also acts as a Probe and provides surface information in the console window.
You can assign a specific mouse probe function and filter using the Mouse Probe dialog box. Once set, clicking the mouse probe button in the graphics window causes the action to occur.
Important: The box and polygon probe functions will only work if Probe is assigned to a "drag" operation, such as RMB Drag, and the default probe setting is a "click" operation. You can change the mouse mappings in the Navigation branch of Preferences, which is accessed via File > Preferences....
>
Use the Function list to choose an action for the mouse probe button.
- off
disables the mouse probe.
- label
displays the label for the selected entity in the graphics window.
- select
enables the selection of an entity by clicking. The selected entity is highlighted in the graphics window and, if open, in a list in most dialog boxes.
prints information about the selected entity in the console. See Reporting Mesh Information for a description of the output.
- box
enables the selection of a group of entities within a box. The selected entities are highlighted in the graphics window and, if open, in a list in most dialog boxes. To define the selection box, click the mouse probe button at one corner of the region to be selected, drag the mouse to the opposite corner, and release the mouse probe button.
- polygon
enables the selection of a group of entities within a polygonal region. The selected entities are highlighted in the graphics window and, if open, in a list in most dialog boxes. To define the selection polygon, click the mouse probe button at one vertex of the polygonal region to be selected, and use the left mouse button to successively select each of the remaining vertices.
Click the mouse probe button again (anywhere in the graphics window) to complete the polygon definition.
Use the Filter selection list to specify the type of entity selected. The available filters are off, cell, face, edge, node, zone, position, object, and size.
Note:
If off is chosen and a selection is made, it is first checked to see if it is a cell, then a face, an edge, and so on.
When the node filter is used, if a cell or face is selected the node closest to the selection point is picked. Thus nodes do not have to be displayed to be picked.
When using box select or polygon select, by default, all entities will be selected. To select only visible entities (nodes, faces, zones, objects) instead, enable Select Visible Entities in the Mouse Probe Function group in the ribbon. The selection will then include only entities visible to the eye, and not those hidden behind other entities in the display. When enabled, ensure that the model is zoomed to an appropriate level for correct selection.
Note:
If the mesh is not connected, all entities (nodes, edges, faces, zones, objects) will be selected irrespective of whether they are visible or not.
This visual selection behavior works only on local displays and may generate warning messages when attempting selection on a remote system.
Text annotations with optional attachment lines may be added to the graphics windows.
>
The text is added to the window at a location chosen with the mouse, using the mouse-probe button (see Controlling the Mouse Buttons for information on setting the mouse buttons). Dragging with the mouse-probe button pressed will draw an attachment line from the point where the mouse was first clicked to the point where it was released. The annotation text will be placed at the point where the mouse button was released.
The annotation text is associated with the active graphics window; it is removed only when the annotations are explicitly cleared. You can edit the text in the graphics window’s caption block by the left mouse button in the desired location. When a cursor appears, you can type the new text or delete the existing text. Text in the caption block will not be deleted when you clear annotations.
The > menu item opens the Controls dialog box to set
file-specific variables called tgvars.
The dialog box has two components: the Categories drop-down list and the actual variables associated with that category.
Select the desired category, and then enter the desired default values. Click Apply to update your file with the new values.