


For steady-state calculations, you will request the start of the solution process using the Run Calculation Task Page (Figure 36.19: The Run Calculation Task Page).
![]() Solution →
Solution → ![]() Run Calculation
Run Calculation
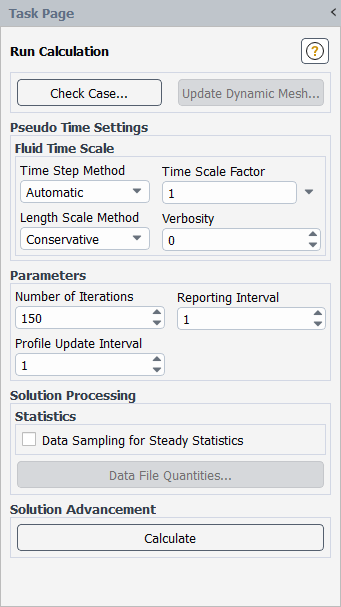
If Global Time Step is selected from the Pseudo Time Method drop-down list in the Solution Methods task page with the pressure-based coupled solver or the density-based implicit solver, you must begin by defining the settings in the Pseudo Time Settings group box, as described in Global Time Step Method Settings. Then for all cases, you must supply the number of additional iterations to be performed by defining the Number of Iterations field in the Parameters group box. (For unsteady calculation inputs, see Inputs for Time-Dependent Problems). If no calculations have been performed yet, Ansys Fluent will begin calculations starting at iteration 1, using the initial solution. If you are starting from current solution data, Ansys Fluent will begin at the last iteration performed, using the current solution data as its starting point.
By default, Ansys Fluent will update the convergence monitors (described in Monitoring Solution Convergence) after each
iteration. If you increase the Reporting Interval from the default of 1 you can get reports
less frequently. For example, if you set the Reporting Interval to 2, the monitors will
print or plot reports at every other iteration. Note that the Reporting Interval also specifies how often
Ansys Fluent should check if the solution is converged. For example, if your solution converges after 40 iterations, but your
Reporting Interval is set to 50, Ansys Fluent will continue the calculation for an extra 10 iterations before
checking for (and finding) convergence.
Important: The Reporting Interval only affects convergence checking of residuals, not of report definitions.
When you click the button, Ansys Fluent will begin to calculate. While the calculation is in progress, a progress bar will appear at the bottom of the Fluent window. For steady-state simulations, clicking the button next to the progress bar will interrupt the calculation at the earliest safe stopping point after the current iteration. Alternatively, you can type Ctrl+c in the console. Transient simulations have additional options for stopping, as described in Inputs for Time-Dependent Problems.
For additional information, see the following sections:
If you have used a user-defined function (UDF) or a named expression (Fluent Expressions Language) to define any boundary conditions, you can control
the frequency with which the function is updated by modifying the value of the
Profile Update Interval. If Profile Update
Interval is set to  , the function will be updated after every
  iterations.
By default, the Profile Update Interval is set to 1. You might want to increase this value if your profile computation is expensive. See the Fluent Customization Manual for details about creating and using UDFs.
After you have performed some iterations, if you decide to start over again from the first iteration (for example, after making some changes to the problem setup), you can reinitialize the solution using the Solution Initialization Task Page, as described in Initializing the Entire Flow Field Using Standard Initialization.
While notionally steady, some simulations tend to exhibit oscillatory or quasi-transient behavior. While in principle, these simulations could be solved as unsteady flow problems and actually resolve the transient behavior, this is often not practical and sometimes unnecessary. Data Sampling for Steady Statistics is useful under such circumstances and helps generate averaged results and trends that are better behaved and useful in flow predictions.
If you enable the Data Sampling for Steady Statistics option in the Run Calculation Task Page (see Performing Steady-State Calculations for details), Ansys Fluent will compute the iteration average (mean) of the instantaneous values, the root-mean-square, and the root-mean-square-errors of those quantities and custom field functions that are enabled/selected in the Sampling Options Dialog Box and/or the Zone-Specific Sampling Options Dialog Box.
The Sampled Iterations field displays the iterations over which data has been sampled for the postprocessing of the mean, RMS, and RMSE values.
Important: Statistics collected for the magnitude of a vector quantity (such as mean-wall-shear-stress) using the Sampling Options dialog box are computed differently than those specified using the Zone-Specific Sampling Options dialog box. The former are computed as the magnitude of the mean, whereas the latter are computed as mean of the magnitude. This can lead to differences in values between the two statistics collection methods.
When you are reviewing the available variables under the Steady Statistics… drop-down lists during
postprocessing of graphics and plot objects (contour, vector, XY plot, and so on), statistics collected based on selections in the
Zone-Specific Sampling Options dialog box contain the -dataset extension.
Sampling Options Dialog Box Method
Use the following steps to have Ansys Fluent gather data for steady statistics while calculating using the Sampling Options dialog box:
(Optional) Create a custom field function for each of the variables of interest for steady statistics postprocessing (for example,
P*|V|) using the Custom Field Function Calculator Dialog Box. Note that you do not need to create custom field functions for the flow shear stresses, flow heat fluxes, wall statistics, or discrete phase variables, as these variables are available for selection later. User Defined → Field Functions →
Custom...
User Defined → Field Functions →
Custom...Enable Data Sampling for Steady Statistics in the Run Calculation task page.
 Solution →
  Run Calculation →
  Data Sampling for Steady Statistics
Enabling this option allows you to display and report the mean and the root-mean-square-error (RMSE) values.
The mean, root-mean-square (RMS), and root-mean-square-error (RMSE) values for solution variables will be available in the Steady Statistics... category of the variable selection drop-down list that appears in postprocessing dialog boxes. For example, in the Contours dialog box, you could select Steady Statistics... and RMSE-uns-custom-function-0 for the Contours of drop-down lists to display the root-mean-square-errors of a custom field function named uns-custom-function-0.
Specify the Sampling Interval.
The Sampled Iterations field displays the iterations over which the data has been sampled for the postprocessing of the mean and RMSE values.
Select the variables for statistics sampling through the Sampling Options Dialog Box.
Solution → Run Calculation →
Sampling Options...Initialize the flow statistics.
Solution → Initialization → Reset
StatisticsNote that you can also reset the flow statistics after you have some data for the steady statistics. For example, if you perform 10 iterations with Data Sampling for Steady Statistics enabled, check the results, and continue with the calculation for another 10 iterations, the steady statistics will include the data gathered in the first 10 iterations, unless you reinitialize the flow statistics.
Zone-Specific Sampling Options Dialog Box Method
Use the following steps to have Ansys Fluent gather data for steady statistics while calculating using the Zone-Specific Sampling Options dialog box:
Enable Data Sampling for Steady Statistics in the Run Calculation task page.
Solution → Run Calculation → Data Sampling for Steady StatisticsEnabling this option allows you to display and report the minimum, maximum, mean, root-mean-square-error (RMSE), and moving average values.
Assuming all options are enabled, the minimum, maximum, mean, root-mean-square-error (RMSE), and moving average values for solution variables will be available in the Steady Statistics... category of the variable selection drop-down list that appears in postprocessing dialog boxes. For example, in the Contours dialog box, you could select Steady Statistics... and Mean-dynamic-pressure-dataset for the Contours of drop-down lists to display the average value of the dynamic pressure.
Specify the Sampling Interval.
The Sampled Iterations field displays the iterations over which the data has been sampled for the postprocessing of the selected values.
Select the variables and desired statistics (minimum, maximum, root-mean-square-error, moving average) for statistics sampling through the Sampling Options Dialog Box.
Solution → Run Calculation →
Sampling Options (Zone Selection)...Note: Statistics are not gathered or computed on shell surfaces.
Initialize the flow statistics.
Solution → Initialization → Reset
StatisticsNote that you can also reset the flow statistics after you have some data for the steady statistics. For example, if you perform 10 iterations with Data Sampling for Steady Statistics enabled, check the results, and continue with the calculation for another 10 iterations, the steady statistics will include the data gathered in the first 10 iterations, unless you reinitialize the flow statistics.