
Using the Device Characterization Wizard for a Basic Dynamic IGBT
The following procedures use an Infineon device as an example. The process is similar for other manufacturer's devices.
Note:
At any time during the characterization process, click Save Model to save your progress.
You can load a characterization with the Import Model tab.
- In the Component
Information [1/12] dialog box, enter the component
name and define the manufacturer data. The detailed
documentation describes some specific settings for several
manufacturers. These are the measurement conditions for the dynamic characteristics.
For example, Infineon/Eupec uses the following settings:
- The Nominal Working Point Values [2/12] dialog box sets nominal values at the device’s working point. As mentioned above, ideally, these are the operating conditions for the device in the design. Practically, these values should be the ones on the manufacturer data sheet with the most information closest to the operating conditions. These are the conditions for which the parameterized device will best match the measured characteristics. For Infineon/Eupec, generally pick the measurement conditions for the dynamic characteristics. Pick the values of VCE and IC mentioned in the table next to the value of the turn-on energy, Eon. Select the temperature for which you have the output characteristics in the plots section. VGE_on and VGE_off are gate voltages used in manufacturer’s test circuit in which switching dynamics are measured. In the datasheet, VGE_on and VGE_off are next to the value of Eon. Cin, the input capacitance, is in the datasheet. Cr, the Feedback (Miller) capacitance can be found in the datasheet, it is sometimes referred to as reverse transfer capacitance. If the values cannot be found in the datasheet, 0 is a good default value, as the characterization tool will then pick a value using the other device characteristics. Click Next to continue.
- On the Breakthrough Values [3/12] dialog box, select the Disable Breakthrough Model check box, as the breakdown characteristics data is rarely available in a data sheet. Click Next to continue.
- The data needed for the Half-Bridge Test Circuit Conditions [4/12]
dialog box is in the tabular section of the data sheet.
For example, for an Infineon/Eupec device:
- Rg is the internal gate resistance found in the datasheet. This value is used as an initial value during the dynamic characterization, rather than the internal gate resistance the characterized device ends up with.
- R_tot is given by R_cc_ee. If the value is given for the module instead of the single switch, divide it by two. If the value is not on the data sheet, 0 is a good default value.
- Ltot, is given by Lsce. If the value is given for the module instead of the single switch, divide it by two. If the value is not on the data sheet, 0 is a good default value.
- L_extern can be given by Ls in the test conditions for Eon. If the value is not there, 30 nH is a good value to use. The characterization wizard will parameterize this value to find a good fit with the dynamic data.
- Rg_on and Rg_off are next to the values of the switching energies Eoff and Eon.
- Cge is generally omitted and a default value of 1e-12F can be used.
- Cload is sometimes found on the datasheet as load capacitance. Use 0 if it is missing.
- When finished setting values, click Next to continue.
- Use the Transfer
Characteristic [5/12] dialog box to parameterize
the threshold voltages and transconductance of the IGBT. Enter the data with SheetScan.
To do so, use the Load characteristics from Dataset
Manager (
 ) above the table and click SheetScan.
Load the graphs in graphic files captured from the manufacturer data sheet using the Picture > Load
picture command.
) above the table and click SheetScan.
Load the graphs in graphic files captured from the manufacturer data sheet using the Picture > Load
picture command.
- For an Infineon/Eupec device, the data sheet plot shows IC=f(VGE).
- Select a coordinate system (Coordinate System > New) and define it on the plot. To do so, you must select three points. Typically, you should use the bottom-right, bottom-left and top-right points of the plot grid. Click Point1, Point2 and Point3 and select the corresponding points on the graph. Enter the corresponding X-Values and Y-Values for these points (read from the plot’s X-axis and Y-axis labels) in the table and click OK to finish defining the coordinate system.
- To define the first characteristic, select Curve > New and give names to the X-axis and Y-axis in the Curve Settings dialog box. Click OK when finished.
- Make sure to note the temperature given on the plot. Then select several points on the curve starting with the lowest X-value. Pick at least 4 points. When done, select File > Export, then click Dataset in the resulting Save dialog box.
- If a plot at a different temperature is available, repeat steps a, b, and c to record additional data.
- When finished, click File > Exit to exit the SheetScan tool, saving the scan setup information if desired.
- In the Datasets dialog box, select the data you want to use at the nominal temperature and click Done. The data is transferred to the Characteristic Data table in the Transfer Characteristic [5/12] dialog box. Make sure to enter the correct values for temperature and Vce, which you recorded during the SheetScan measurements.
- If you also recorded plot data for
a different temperature, click Add new
characteristic (
 ) in the top right corner, then click Load characteristics from Dataset Manager
(
) in the top right corner, then click Load characteristics from Dataset Manager
( ) above
the table to load the additional data. Select the plot in the first tab
for the Nominal Temperature field
of the Fitting Characteristic Order
panel. If you added a second set of data for a different temperature,
you can select this plot for the Different
Temperature field, or select Not
Used, if data is available only for one temperature.
) above
the table to load the additional data. Select the plot in the first tab
for the Nominal Temperature field
of the Fitting Characteristic Order
panel. If you added a second set of data for a different temperature,
you can select this plot for the Different
Temperature field, or select Not
Used, if data is available only for one temperature.
- Click Start Fitting to fit the characteristics, then examine the resulting plot to check the match of the fit. Click Next to continue.
- Use the Output Characteristic [6/12] dialog box to parameterize more of the IGBT’s DC characteristics. Ideally, enter the output characteristics at Vge=VGE_on (Full Saturated Branch) and for Vge at a lower voltage (Semi Saturated Branch), for both the nominal temperature and at a different temperature using SheetScan as described in step 5. Make sure to note the value of Vge and the corresponding temperature for each curve.
- For Infineon/Eupec, the plot shows IC=f(VCE). The output characteristics of the semi-saturated branch are often missing at a different temperature.
- Add up to four characteristics, making sure to identify them with the correct values of VGE and temperature.
- Select the plot at the nominal temperature and with Vge=VGE_on for the Full Saturated Branch (Tnom) field in the Fitting Characteristic Order panel, and one at a lower value of Vge for the Semi Saturated Branch (Tnom) field, or select Not Used, if the data is not available. Repeat this at a different temperature for Vge=VGE_on and at a lower Vge in the corresponding Full Saturated Branch (Tdiff) and Semi Saturated Branch (Tdiff) fields. The fit will be better if the current does not saturate much for the semi-saturated curve, but the fitting algorithm will work with either option.
- Click Start Fitting to start the fit and examine the plot to check the match of the fit. Click Next to continue.
- Use the Freewheeling Diode Characteristic [7/12] dialog box to parameterize the DC characteristics of the diode. Ideally, you should enter the diode forward characteristic If(Vf) at both the nominal temperature and at a different temperature using SheetScan as outlined in step 5. Make sure to note the value of the temperature for each curve.
- For Infineon/Eupec, the data sheet plot shows IF=f(VF).
- Generate two characteristic data sets, one at the nominal temperature and one at a different temperature, being sure to identify them with their corresponding temperatures.
- Select the plot at the nominal temperature in the Nominal Temperature field of the Fitting Characteristic Order panel, and the plot at the different temperature in the Different Temperature field, or select Not Used, if the data is not available.
- Click Start Fitting to start the fit and examine the plot to check the match of the fit. Click Next to continue.
- Use the IGBT Thermal Model [8/12] dialog box to parameterize the thermal impedance of the IGBT. Do one of the following:
- If the data sheet provides extracted values for ri and ti, which is the case for Infineon/Eupec, enter these four value pairs in the Continued/Partial Fraction Coefficients table, click Start Fitting, check the plot, and click Next to continue.
- If the data sheet does not provide extracted values for ri and ti, select Use Transient Thermal Impedance and enter the plot data for the thermal characteristics using SheetScan per the instructions given in step 5. The plot shows the impedance as a function of time. Make sure to adjust the scale of the coordinate system in SheetScan to logarithmic if needed. Select Start Fitting to start the fit and examine the plot to check the match of the fit. Click Next to continue.
Note:
Sample the "single pulse" curve when multiple transient thermal impedance curves are presented in the data sheet.
- Use the Freewheeling Diode Thermal Model [9/12] dialog box to parameterize the thermal impedance of the diode.
- If the data sheet provides extracted values for ri and ti, which is the case for Infineon/Eupec, enter these four value pairs in the Continued/Partial Fraction Coefficients table, click Start Fitting, check the plot, and click Next to continue.
- If the data sheet does not provide extracted values for ri and ti, select Transient Thermal Impedance and enter the plot data for the thermal characteristics using SheetScan per the instructions given in step 5. The plot shows the impedance as a function of time. Make sure to adjust the scale of the coordinate system in SheetScan to logarithmic if needed. Select Start Fitting to start the fit and examine the plot to check the match of the fit. Click Next to continue.
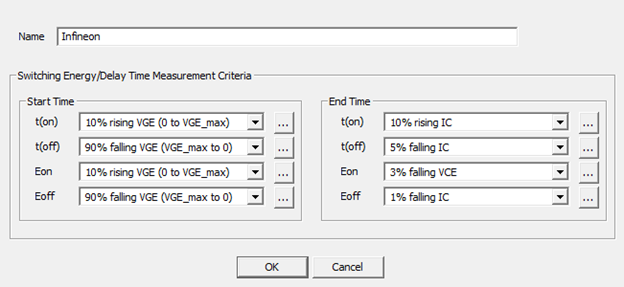
- Use the Dynamic Model Input [10/12] dialog box to parameterize the dynamic characteristics of the IGBT. You can select to fit for the switching energies (Eon and Eoff) and switching times (T(on) and T(off)). The nominal point must be fit, so the data must be available. The Advanced Settings button allows for more control over the characterization process, but should not be necessary to change for most devices. Check the Advanced Settings documentation for more information.
- Click Measurementto open the Measurement Data dialog box and make sure the settings correspond to the ones for the manufacturer of the device being characterized.
- If data is available at different temperature, add it to the dT row.
- If data is available at a different value of VCE, add the lower value of VCE to the nV row and the higher value of VCE to the pV row.
- If data is available at a different value of Ic, add the lower value of Ic to the nI row and the higher value of Ic to the pI row.
- Click Extraction to start the fit and click Next to continue.
Advanced Settings
- TR and TF are the rise and fall time from the data sheet. These should be set to 0 if one is uncertain, as their value can affect the convergence.
- There are three loops. The first loop uses a 1D search method to find a better solution. To enable it, set LOOPS_A to an integer number larger than 0. MASKPAR_A contains the names of the parameters changed by the characterization tool to find a better fit. RESORD_A sets how the residue is defined: 0 for the maximum error, 1 for the average error, and 2 for the root mean square error. RESTOL_A defines the value under which the residue must get to leave the loop with a good solution.
- The second and third loops (B and C) use a Jacobian matrix method. LOOPS_B and LOOPS_C set the number of pre-loops which are taken for the second and third loop; usually one should suffice. MASKPAR_B and MASKPAR_C contain the names of the parameters changed by the characterization tool to find a better fit during the second and third loop. MATRIX_B and MATRIX_C set the maximum number of Jacobian recalculations, while ZEROFN_B and ZEROFN_C set the maximum number of constant Jacobian calculations. RESLOC_B and RESLOC_C set the maximum number of relaxation which occurs within a constant Jacobian calculation. RESORD_B and RESORD_C set how the residue is defined: 0 for the maximum error, 1 for the average error, and 2 for the root mean square error. RESTOL_B and RESTOL_C define the value under which the residue must get to leave the second and the third loop with a good solution; if it is zero, it gets this value from the worksheet.
- Use the Dynamic Parameter Validation [11/12] dialog box to validate the dynamic extraction. The actual values of the switching times and energies for the parameterized device will be calculated. Enable the conditions that should be checked, then click Validate. Click Next to continue.
- Use the Model Parameters [12/12] dialog box to browse the extracted parameters.
- To generate an .sml file of the model, click Create SML.
- Click Finish to close the dialog box. The characterized device is generated for you to place in the Twin Builder project.