


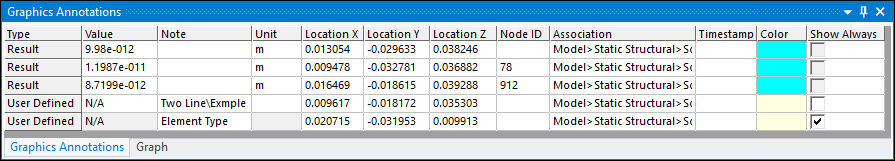
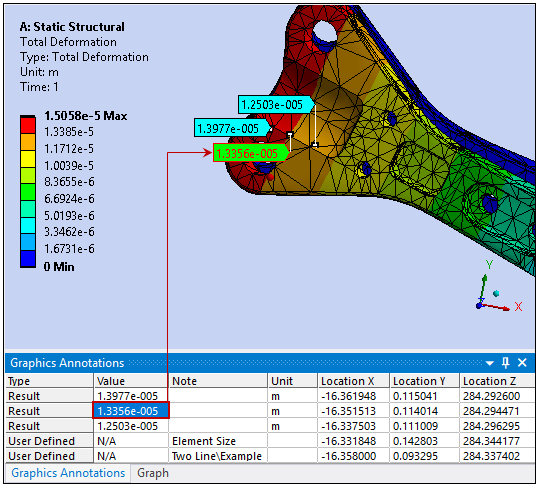
The Graphics Annotations window, illustrated below, displays a table of user-defined annotations. The annotations are either a note that you place on your model using the option or the display of a specific result value at its coordinate location on your model, using the Probe option.
| These annotations are labels that you place on your model that include a/an: | |
|
|
Go to a section topic:
Application
The Graphics Annotations window displays automatically when you:
Place an annotation on your model. Select the option from the Insert group on the Home tab and then click a location on your model.
Or...
Note: The Insert group displays on numerous Context tabs.
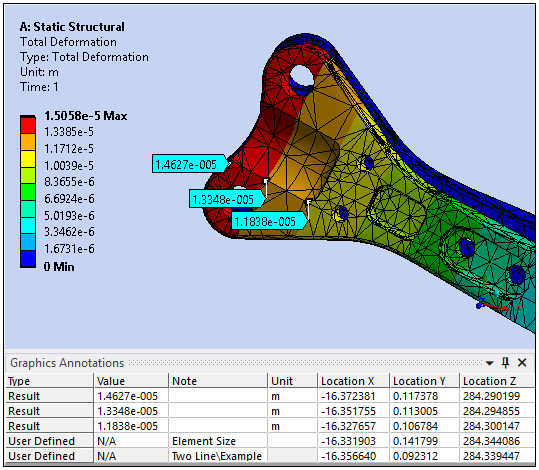
Place a probe on your model. Select a result object, select the Probe option on the Result Context Tab, and then click a location on your model.
Note: For the Probes feature:
Annotations are not supported for results scoped to edges and vertices.
Values are cleared if you re-solve your simulation.
Values for positions inside of an element may differ from hand-calculated values, especially for certain user defined result expressions. See the limitations topic in the Interpolation of Result Values section.
Annotation Types
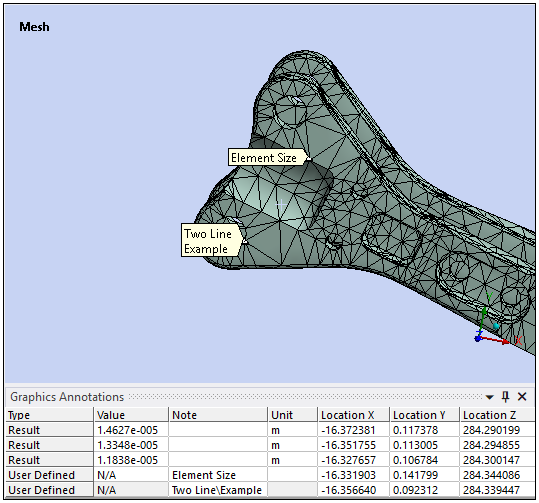
Examples of the annotation types as displayed in the Geometry window are shown below.
| User Defined Graphics Annotation | Probe Annotations for Result |
|
|
|
Graphics Annotations Window Features
The Graphics Annotations window provides the following options once you have created annotations:
- Write Notes
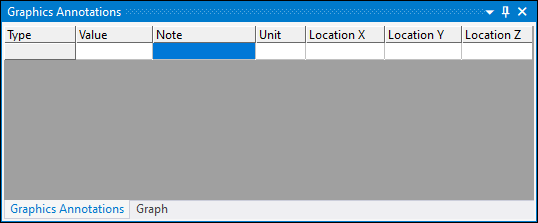
When you select the option in the Insert group and place the annotation on a point of your model, the Graphics Annotations window displays as shown below. The Note cell of the table is active and you can being to type your note. You can edit the text entry for a user-defined annotation by double-clicking the annotation’s Note cell. Your text entries can span more than one line using the backslash (\) keyboard character. Note the "Two Line" note example above.
- Highlight Values
Selecting a table cell in the Value column (or a cell of the Association column) or selecting the annotation label in the Geometry window, highlights the annotation in the table as well as in the Geometry window. Note that for a user-defined annotations, the Geometry display switches to the corresponding object of the tree that includes the annotation, such as the Element Size example shown above.
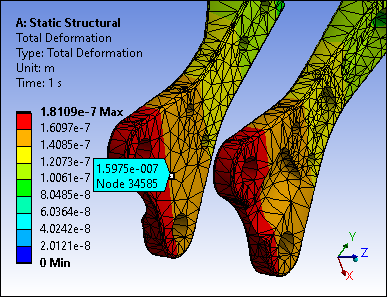
- Display Node IDs
Using the Show Node ID in Snap-Probe Labels preference of the Graphics category in the Options dialog, you can include the Node ID in the probe label, as illustrated below.
- Move Labels
Selecting the option on the Graphics Toolbar enables you select and then drag-and-drop an annotation.
Moving a Text Label
You can only reposition a text label on the model. Once repositioned, the label will rotate and move in space with the model.
Moving a Probe Label
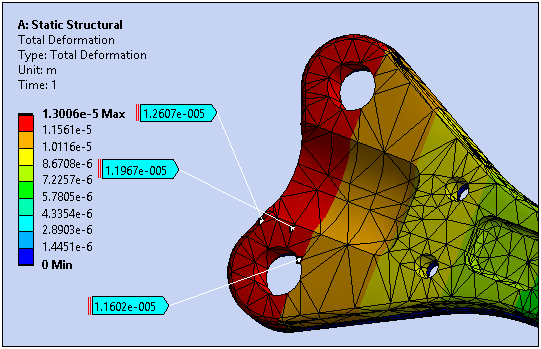
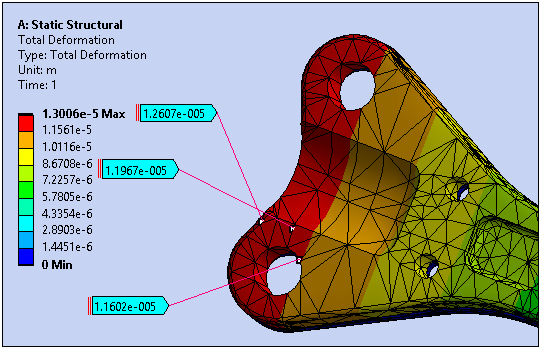
Probe labels can be moved anywhere within the Geometry window. As illustrated below, a white line directs you to the probe's location on the model. Also, two vertical red lines appear beside a label when it is moved. You can then freely drag-and-drop the annotation to a different location. Once moved, the label is stationary. If you rotate or move the model, the label remains in the same position in the window. As needed, you can simply return the annotation to the original position or drag-and-drop it to an new position in order to reposition it along with the model.
To return probe labels to their original position (the anchor of the probe always remains in the original position), select the annotation in the Geometry window or in the window and press the Esc key. You can select multiple probes using the Ctrl key.
- Change Probe Line Coloring
You can change the color of the line connecting the probe label to its location on the model using the Probe Line Color property in the Graphics category of the Options dialog.
- Change Label Color
When you double-click a cell in the Color column, a color selection pane displays that enables you to change the color of the label.
- Display Annotation Labels Continuously
For user-defined annotations (not probes), you can select the check box under the Show Always column to have that label remain displayed regardless of the object or interface selection you make.
- Display Obscured Labels
The Options dialog contains a Graphics category preference, Obscured Label Display Style, that enables you to change the display of an annotation label and/or probe that is not visible because of the orientation of your model. The options include (default), , and . When a label or probe is on the opposite side of the model’s current orientation, you can choose whether to have it show “through” the model using the Solid and Translucent options or not at all using the option.
Also note that the Graphics category includes an associated preference: Unobscured Label Tolerance Factor. For the or options, this tolerance enables you make small adjustments to make sure that a label behaves as expected in the event a label displays as obscured when it should not. For example, when a label’s position is located slightly within a curved surface rather than directly on the surface. This is most likely a result of how the application calculates the location of a label. The tolerance range is between 0 and 1. Small incremental changes, such as 0.0001 can be appropriate to properly display obscured labels.
- Select Context Menu Options
As illustrated below, the window provides a context menu when you make a table selection and then right-click the mouse.
Context Menu Options
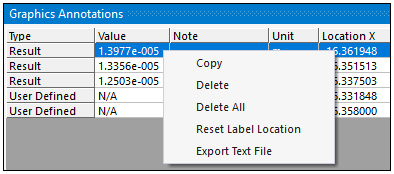
Option Descriptions
: copy the content contained in the row into the clipboard.
: delete table selections.
: delete all table content.
: return all selected probes to their original position.
: export table content to a text file.
- Manually Delete Annotations
To delete an annotation, select a row in the window or select the annotation label in the Geometry window, and then press the Delete key. You can select multiple probe labels or table cells using the Ctrl key.