


The Mesh Metric option allows you to view mesh metric information and thereby evaluate the mesh quality. Once you have generated a mesh, you can choose to view information about any of the following mesh metrics: Element Quality, for triangles or quadrilaterals, Jacobian Ratio (MAPDL, corner nodes, or Gauss points), Warping Factor, Parallel Deviation, Maximum Corner Angle, Skewness, Orthogonal Quality, Characteristic Length (Autodyn), Minimum Tri Angle, Maximum Tri Angle, Minimum Quad Angle, Maximum Quad Angle, Warping Angle, Tet Collapse, Aspect Ratio (Explicit), Minimum Element Edge Length, Maximum Element Edge Length and Characteristic Length (LS-DYNA). Selecting turns off mesh metric viewing.
When you select a mesh metric, its Min, Max, Average, and Standard Deviation values are reported in the Details View, and a bar graph is displayed under the Geometry window. The graph is labeled with color-coded bars for each element shape represented in the model's mesh, and can be manipulated to view specific mesh statistics of interest.
Note: If the model contains multiple parts or bodies, you can view the mesh metric information for an individual part or body. To do so, return to the Tree Outline. Under the Geometry object, click the specific part or body of interest. The Details view displays the Nodes, Elements, Min, Max, Average, and Standard Deviation values for the selected metric and part/body under Statistics. (The graph is not available at the part/body level.)
Accessing Mesh Metric Information
To access mesh metric information:
Generate the mesh. You can view mesh metric information for any mesh that was successfully generated using the Generate Mesh, Preview Surface Mesh, or Preview Inflation feature.
Click the Mesh object in the Tree Outline.
In the Details View, expand the Quality folder.
For the Mesh Metric control, select the metric of interest from the drop-down menu.
By default, the Min, Max, Average, and Standard Deviation values for the selected metric are reported in the Details View. In addition, a bar graph is displayed under the Geometry window.
Note: To view the numbers of Nodes and Elements in the meshed model, expand the Statistics folder in the Details View.
Viewing Advanced Mesh Statistics
When you select a mesh metric, a bar graph is displayed as shown in Figure 34: Mesh Metrics Bar Graph. For this illustration, the mesh metric was selected in the Details View, so the bar graph displays the minimum to maximum values over the entire mesh.
In Figure 34: Mesh Metrics Bar Graph, the X-axis represents the value of the selected mesh metric. Using the Y-Axis Option setting described in Using the Bar Graph Controls, you control whether the Y-axis represents the number of elements within a particular quality factor range (the default), or the percentage of the total volume represented by the elements within a particular quality factor range. In Figure 34: Mesh Metrics Bar Graph, the Y-axis represents the number of elements. The alternative would be for the Y-axis to represent the percentage of the total volume. Remember that a model could have a large number of poorly shaped elements that are confined to a small local area. The total volume of these elements might not be significant compared to the volume of the entire model. As a result, the bar corresponding to this low quality factor may not be significant. The Mesh Metric option displays the selected mesh metric without qualifying the elements for acceptability.
Additional, characteristics of the bar graph include:
The graph is displayed only when a mesh metric is selected. If you set Mesh Metric to , the graph is not displayed. Alternatively, you can click the button on the toolbar to hide/show the graph.
Resuming a model retains the last-saved state of the graph.
Clicking the Controls button accesses the graph controls described in Using the Bar Graph Controls.
The location of an individual bar along the X-axis is the mid-point of the range of metric values covered by that bar.
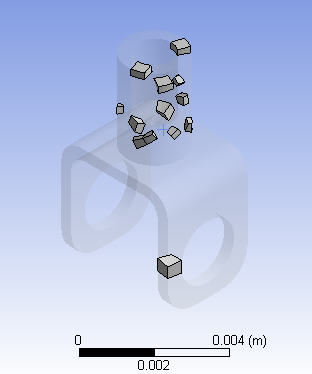
Clicking an individual bar on the graph (or in the column of white space above the bar) changes the view in the Geometry window. The geometry becomes transparent and only those elements meeting the criteria values corresponding to the selected bar are displayed, as shown in Figure 35: Geometry View After Selecting an Individual Bar. (The option to click in the column above the bar is helpful if the graph contains very short bars that are difficult to click.)
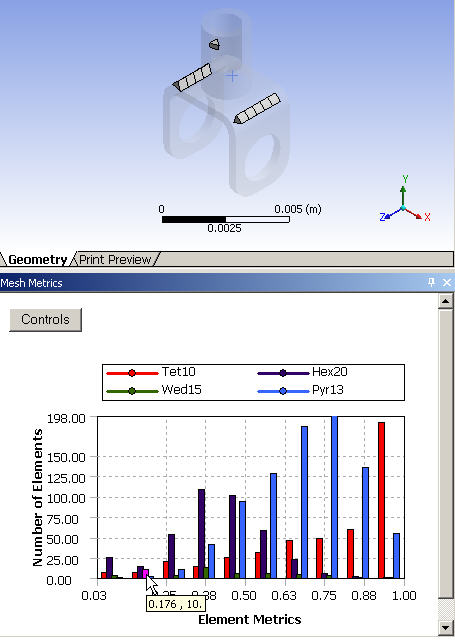
If you click and hold the cursor on an individual bar or column, you see a tooltip showing the metric value associated with the bar, along with either a number of elements or the percent of total volume represented by the elements (depending on the Y-Axis Option setting). For example, in Figure 36: Clicking and Holding on an Individual Bar, 0.176 is the mid-point of the range of metric values covered by the selected bar, and there are 10 elements with values that fall within that range. The 10 elements are displayed in the Geometry window.
To select multiple bars, hold the Ctrl key and click all desired bars. All elements corresponding to all selected bars are displayed in the Geometry window.
To return the Geometry window to the full mesh view (no transparency, all elements are displayed), click on empty white space on the graph. Empty white space does not include the column of white space above a bar, as clicking in this area selects the bar and displays only those elements associated with it.
If you click in a column for which there are 0 elements, all that is displayed in the Geometry window is the transparent geometry.
The graph can be filtered based on element types. See Using the Bar Graph Controls for more information.
The graph respects section planes and hiding of bodies in the Geometry window. For example, if you hide a body and then click an individual bar to view the elements corresponding to the selected bar, elements in the hidden body are not displayed in the Geometry window, even if they meet the criteria that the bar represents.
To zoom the graph, hold the ALT key and use your mouse to define a selection box on the graph (click the graph and drag the mouse downward and to the right to define the area to zoom, then release the mouse button). To reset the graph to its initial view, hold the ALT key, click the graph and drag the mouse downward and to the left, then release the mouse button.
The values of the X-axis and Y-axis labels on the graph correspond to the visible ranges, rather than to global values. For example, the value 198 in Figure 36: Clicking and Holding on an Individual Bar is the maximum end of the range for the Y-axis, based on the current content of the graph. If you zoom the graph or define a new range of values to display as described in Using the Bar Graph Controls, the values of the X-axis and Y-axis labels change accordingly along with the content of the graph.
Using the Bar Graph Controls
When you click the button on the graph, the graph is replaced by the controls page as shown in Figure 37: Bar Graph Controls Page. Clicking the button applies any changes on the controls page and returns you to the graph.
From the controls page shown in Figure 37: Bar Graph Controls Page, you can set the following values:
Y-Axis Option - Determines what the heights of the bars represent. Options include Number of Elements and Percent of Volume/Area. The default is Number of Elements.
Number of Bars - Determines the number of bars to include in the graph. You can enter any whole number greater than or equal to 0. The default is 10. When you click Update Y-Axis, the Min and/or Max values for the Y-Axis are recomputed so that the graph and the Y-Axis values on the controls page reflect the new number of bars.
Range - Defines a range for the selected metric to display only those elements that fall within the specified range.
X-Axis - Specify a Min and/or Max value. To locate and estimate the number of worst elements in the mesh, adjust the Min and Max values to the lower or upper end of the quality criterion (depending on metric) and click Update Y-Axis. (Determining the distribution and location of all the bad elements at one time is helpful in cases where you may need to re-import your model into the DesignModeler application to remove the corresponding problematic geometry.) Click Reset to return to the X-Axis defaults. (Note: Negative values are acceptable.)
Y-Axis - Specify a Min and/or Max value. By lowering the Max value, you can clip the Y-axis for easier visualization of small bars, especially as they relate to different element types. Click Reset to return to the Y-Axis defaults.
List of element types - Determines which element types to include in the graph. Element types that do not appear in the mesh are read-only on the controls page. Select the element types that you want to include in the graph, or click Select All to include all available element types in the graph. By default, all available element types are selected.
Note: Because the bars approximate the metrics across the range of the X-Axis, choosing a very small number of bars over a large X-Axis range may move the bars away from the actual average metric of the elements represented by each bar.
Calculation Details
For information about the calculations that are performed for each metric, refer to:
- Element Quality
- Aspect Ratio Calculation for Triangles
- Aspect Ratio Calculation for Quadrilaterals
- Aspect Ratio Calculation for Tetrahedrons
- Jacobian Ratio
- Warping Factor
- Parallel Deviation
- Maximum Corner Angle
- Skewness
- Orthogonal Quality
- Characteristic Length (Autodyn)
- Minimum Tri Angle
- Maximum Tri Angle
- Minimum Quad Angle
- Maximum Quad Angle
- Warping Angle
- Tet Collapse
- Aspect Ratio (Explicit)
- Minimum Element Edge Length
- Maximum Element Edge Length
- Characteristic Length (LS-DYNA)