


In order to visualize the internal flow of a 3D problem or create XY plots of solution variables for 3D results, you must select portions of the domain (surfaces) on which the data is to be displayed. Surfaces can also be used for visualizing or plotting data for 2D problems, and for generating surface-integral reports.
Ansys Fluent allows you to create several kinds of surfaces, and stores all surfaces in the case file. You can create the surfaces through the ribbon and the outline view and you can review and modify the existing surfaces in the outline view under the Results branch. These surfaces and their uses are described briefly below:
- Zone Surfaces:
If you want to create a surface that will contain the same cells/faces as an existing cell/face zone, you can generate a zone surface. This kind of surface is useful for displaying results on boundaries.
- Partition Surfaces:
When you are using the parallel version of Ansys Fluent, you may find it useful to create surfaces that are defined by the boundaries between mesh partitions. You can then display data on each side of a partition boundary.
See Parallel Processing for more information about running the parallel solver.
- Point Surfaces:
To monitor the value of some variable or function at a particular location in the domain, you can create a surface consisting of a single point.
- Structural Point Surfaces:
To monitor the value of some variable or function at a point in a particular cell of a solid zone in a simulation that uses the structural model, you can create a surface consisting of a single point. For example, you could monitor the displacement of a solid cell as it moves / deforms as part of a two-way intrinsic fluid-structure interaction (FSI) simulation.
- Line and Rake Surfaces:
To generate and display pathlines, you must specify a surface from which the particles are released. Line and rake surfaces are well-suited for this purpose and for obtaining data for comparison with wind tunnel data. A rake surface consists of a specified number of points equally spaced between two specified endpoints. A line surface is simply a line that includes the specified endpoints and extends through the domain; data points will be at the centers of the cells through which the line passes, and consequently will not be equally spaced.
- Plane Surfaces:
If you want to display flow-field data on a specific plane in the domain, you can create a plane surface. A plane surface is simply a plane that passes through three specified points. Note that you can create multiple plane surfaces at once using Figure 39.12: The Plane Surface Dialog Box.
- Quadric Surfaces:
To display data on a line (2D), plane (3D), circle (2D), sphere (3D), or quadric surface you can specify the surface by entering the coefficients of the quadric function that defines it. This feature provides you with an explicit method for defining surfaces.
- Iso-surfaces:
You can use an iso-surface to display results on cells that have a constant value for a specified variable. Generating an iso-surface based on
 ,
,  , or
, or  coordinate, for example, will give you an
  ,
,  , or
, or  cross-section of your domain. Generating an iso-surface based on pressure
will enable you to display data for another variable on a surface of constant pressure.
Note that you can create multiple iso-surfaces at once using Figure 39.18: The Iso-Surface Dialog Box.
cross-section of your domain. Generating an iso-surface based on pressure
will enable you to display data for another variable on a surface of constant pressure.
Note that you can create multiple iso-surfaces at once using Figure 39.18: The Iso-Surface Dialog Box.
Note:
In some instances, newly created surfaces (except zone/line/point/rake) may contain erroneous lines. This can happen for surfaces created in any type of cell zone, but it is more likely in zones containing polyhedral mesh elements. Displaying a contour plot on these surfaces or displaying the surfaces directly may show these line edges. To reduce their appearance you can change the lighting method to Flat.
2D planar surfaces, such as planes and iso-surfaces of the mesh, may seem to disappear when viewed from an angle that is parallel to the line of sight. This occurs because the 2D surface does not have a thickness. If you enable Edges in the Mesh Display dialog box before displaying, then the surface will appear as a line instead of disappearing.
Zone surfaces are useful for displaying results on boundaries. For example, you may want to plot contours of velocity magnitude at the inlet and outlet of the problem domain, or temperature contours on the domain’s walls. To do so, you need to have a surface that contains the same faces (or cells) as an existing face (or cell) zone. Zone surfaces are created automatically for all boundary face zones in the domain, so you will generally not need to create any zone surfaces unless you accidentally delete one.
Use the text command: surface/reset-zone-surfaces to recreate any
missing surface zones by resetting the case surface list.
To create a zone surface, you will use the Zone Surface Dialog Box (Figure 39.1: The Zone Surface Dialog Box).
![]() Domain → Surface
→ Create → Zone...
Domain → Surface
→ Create → Zone...
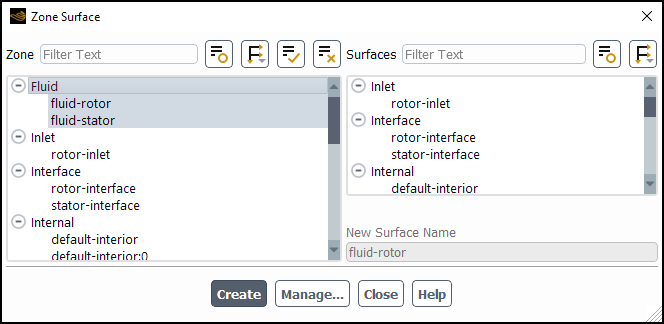
The steps for creating the zone surface are as follows:
Select the zone(s) in the Zone list.
Enter a name in New Surface Name if you do not want Ansys Fluent to assign a default name to the newly created surface. By default, Fluent assigns each surface the same name as the zone that it corresponds to. If a surface already exists with that name, Fluent assigns the surface a unique name using the
zone-surfaceprefix (for example,zone-surface-6).If you do not want to use the default name, enter a new name in New Surface Name. If the New Surface Name that you enter is the same as a surface that already exists, Fluent assigns the new surface a unique name using the
zone-surfaceprefix (for example,zone-surface-7).
Important:The surface name that you enter must begin with an alphabetical letter. If your surface name begins with any other character or number, Fluent rejects the entry.
If you are selecting multiple zones, you do not have the option to choose the surface names. Ansys Fluent automatically give the surfaces the same names as their corresponding zone.
Click . The new surface name is added to the Surfaces list in the dialog box.
If you want to delete or otherwise manipulate any surfaces, click to open the Surfaces Dialog Box. For details, see Grouping, Prioritizing, Editing, Renaming, and Deleting Surfaces.
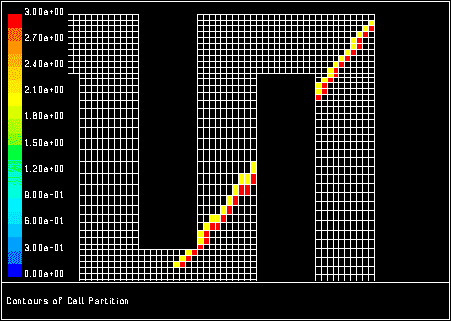
If you are using the parallel version of Ansys Fluent (see Parallel Processing), you may find it useful to create data surfaces defined by the boundaries of mesh partitions. As described in Mesh Partitioning and Load Balancing, partitioning the mesh divides it into groups of cells that can be solved on separate processors when you use a parallel solver. A partition surface will contain faces or cells on the boundary of two mesh partitions. For example, you can plot solution values on the partition surface to determine how the solution is changing across a partition interface, as shown in the following figure:
To create a partition surface, you will use the Partition Surface Dialog Box (Figure 39.3: The Partition Surface Dialog Box).
![]() Domain → Surface
→ Create → Partition...
Domain → Surface
→ Create → Partition...
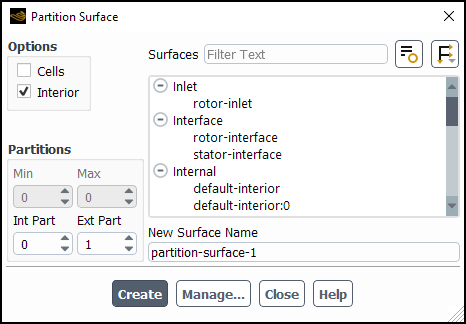
The procedure for creating the partition surface are as follows:
Specify the partition boundary in which you are interested by indicating the two bordering partitions under the Partitions heading. The boundary that defines the partition surface is the boundary between the "interior partition" and the "exterior partition". Int Part indicates the ID number of the interior partition (that is, the partition under consideration), and Ext Part indicates the ID number of the bordering (exterior) partition. The Min and Max fields will indicate the minimum and maximum ID numbers of the mesh partitions. The minimum is always zero, and the maximum is one less than the number of processors. If there are more than two mesh partitions, each interior partition will share boundaries with several exterior partitions. By setting the appropriate values for Int Part and Ext Part, you can create surfaces for any of these boundaries.
Choose interior or exterior faces or cells to be contained in the partition surface by selecting or clearing Cells and Interior under Options. To obtain a surface consisting of cells that are on the "interior" side of the partition boundary, select both Cells and Interior. To create one consisting of cells that are on the "exterior" side, select Cells and clear Interior. If you want the surface to contain the faces on the boundary instead of the cells, clear the Cells option. To have the faces reflect data values for the interior cells, select the Interior check box, and to have them reflect values for the exterior cells, clear it.
If you do not want to use the default name assigned to the surface, enter a new name under New Surface Name. The default name is the concatenation of the surface type and an integer that is the new surface ID (for example,
partition-surface-6). (If the New Surface Name you enter is the same as the name of a surface that already exists, Ansys Fluent will automatically assign the default name to the new surface when it is created.)Important: The surface name that you enter must begin with an alphabetical letter. If the name of the surface begins with any other character or number, Ansys Fluent rejects the entry.
Click . The new surface name is added to the Surfaces list in the dialog box.
If you want to delete or otherwise manipulate any surfaces, click to open the Surfaces Dialog Box. For details, see Grouping, Prioritizing, Editing, Renaming, and Deleting Surfaces.
If you want to display results on surfaces that are more complicated than a simple point or
plane, then you can import a custom surface representing the region of interest
(.stl, .msh, or .cas
format) and “imprint” this surface into the current mesh. For example, you may
want to visualize only a smaller custom portion of a much larger (complex) geometry.
To create an imprinted surface, use the Imprint Surface Dialog Box (Figure 39.4: The Imprint Surface Dialog Box).
![]() Domain → Surface
→ Create → Imprint...
Domain → Surface
→ Create → Imprint...
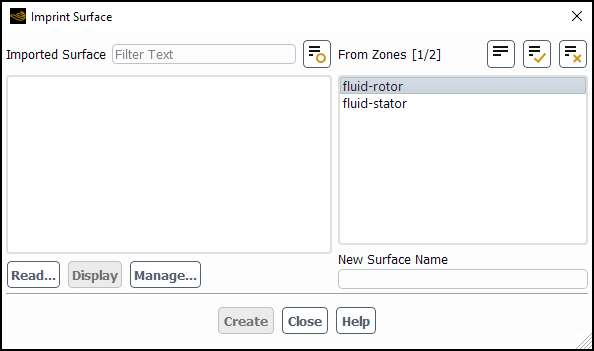
Create an imprinted surface as follows:
Click and select your geometry file (
.stl,.msh, or.casformat) using the Select File dialog box.Specify the units the mesh was created in (default is meters).
Click to upload your file.
The name of your geometry file appears in the Imported Surface dialog box.
Select the zone where your geometry is located in the From Zones group box.
Note: If you do not specify a zone, Fluent uses the entire domain for imprinting. For a large mesh this could be time consuming.
Enter a name for your new surface in the New Surface Name dialog box.
The default name is
<orig-name>(imprint)<id>.Click to create the new surface.
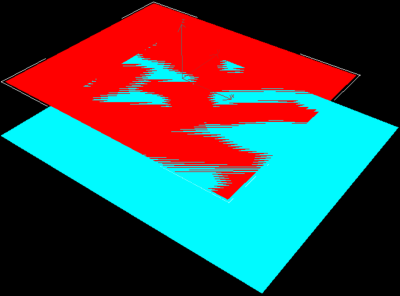
When an imported surface is imprinted, a postprocessing surface that coincides with the imported surface is created. The imprinted surface will not have facets for the portions of the original surface that lie outside the domain. Different postprocessing operations such as contour and vector plots, and surface integrals can be performed on this surface. However, the edges of the imprinted surface may not coincide with those of the original surface, if the edges of the original surface do not coincide with mesh edges. An example is shown in the following picture.
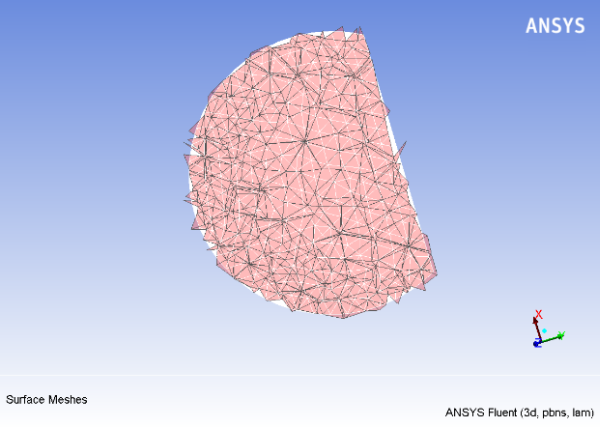
As you can see in Figure 39.5: Imprinted Surface (pink) Superimposed Over Imported Surface (white), there are deformities around the edges of the imprinted surface.
Important: Ensure the units and scaling are consistent between the imprint surfaces and the case file.
If you want to create an imprint surface from multiple disconnected source surfaces, it is better to create multiple imprint surfaces (one per source surface) and, if required, group them together after they are created. For information on grouping surfaces, see Grouping, Prioritizing, Editing, Renaming, and Deleting Surfaces.
You may often be interested in displaying results at a single point in the domain. For example, you may want to monitor the value of some variable or function at a particular location. To do this, you must first create a "point" surface, which consists of a single point. When you display node-value data on a point surface, the value displayed is a linear average of the neighboring node values. If you display cell-value data, the value at the cell in which the point lies is displayed.
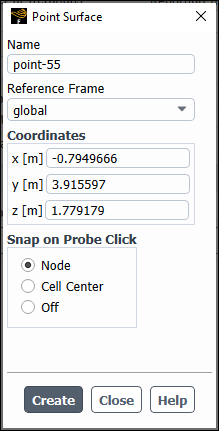
To create a point surface, use the Point Surface Dialog Box (Figure 39.6: The Point Surface Dialog Box).
![]() Domain → Surface
→ Create → Point...
Domain → Surface
→ Create → Point...
Create a point surface as follows:
(Optional) Provide a name for the point surface if you do not want to use the default name.
Important: The surface name that you provide must begin with an alphabetical letter. If the name of the surface begins with any other character or number, Ansys Fluent rejects the entry.
Specify the location of the point. There are three different ways to do this:
Right-click in the domain to specify the point using the mouse probe tool (you can also left-click if you click the probe button in the toolbar—
 ). The point tool automatically snaps to the nearest
Node or Cell Center, depending on the option
selected in the Snap on Probe Click group box.
). The point tool automatically snaps to the nearest
Node or Cell Center, depending on the option
selected in the Snap on Probe Click group box.
Note:You can make it so points are snapped to their closest valid location on the domain by enabling the
surface/closest-point-searchtext command in the Console. This setting avoids point surface creation failures when the point surface is created from the text user interface or graphics user interface.In some instances, Fluent may snap to the center of a neighboring cell, when Snap on Probe is set to Cell Center.
Move the point tool (
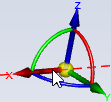 ) to the location in the domain where you want the point surface
created. Refer to Using the Point Tool for additional information.
) to the location in the domain where you want the point surface
created. Refer to Using the Point Tool for additional information.Enter the coordinates (x, y, z) under Coordinates.
Click to create the new surface.
If you want to check that your new surface has been added to the list of all defined surfaces, or you want to delete or otherwise manipulate any surfaces, expand the Surfaces branch in the Outline View tree (under Results). For details, see Grouping, Prioritizing, Editing, Renaming, and Deleting Surfaces.
Note: If you have trouble visualizing a point surface while running Fluent in parallel, contact your support representative for assistance with resolving the issue.
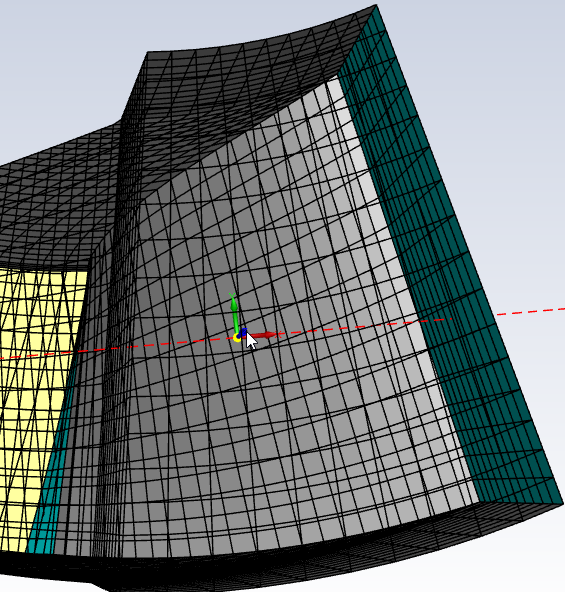
The point tool allows you to define the location of a point surface directly in the graphics window. You can drag the point tool to the desired location on the model.
Move the tool by left-clicking and holding any of the axes to move in an axial direction, or by clicking the ball in the middle of the point tool to move it freely. (You may find it helpful to display mesh faces to ensure that the point tool is correctly positioned inside the domain.)
(Optional) Click the Front Faces Transparent icon in the toolbar (![]() ) to make it easier to see the point tool once it is inside the
model.
) to make it easier to see the point tool once it is inside the
model.
Note:
For 2D cases, snapping with the point tool requires a cell zone displayed with faces enabled in the active window. Displaying only the "default-interior" does not provide Fluent with the information needed to snap to the selected location.
You can control the size of the point tool triad using the Graphics triad tool size field in the Graphics branch of Preferences (File>Preferences...). Note that the updated tool size only appears after restarting the Fluent application.
If you manually input a value for the x, y, or z-coordinate that is outside the domain, the point tool will move to that location, but it will lose its interactivity.
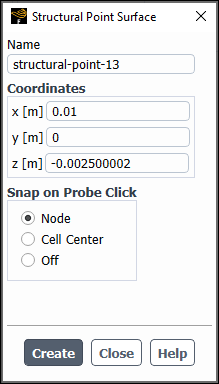
You may be interested in reporting data at a point in a particular cell of a solid zone in a simulation that uses the structural model. For example, you may want to monitor the displacement of a solid cell as it moves / deforms as part of a two-way intrinsic fluid-structure interaction (FSI) simulation. To do this, you must first create a structural "point" surface, which consists of a single point. When you display node-value data on a structural point surface, the value displayed is a linear average of the neighboring node values. If you display cell-value data, the value at the cell in which the point lies is displayed.
To create a structural point surface, use the Structural Point Surface Dialog Box (Figure 39.9: The Structural Point Surface Dialog Box).
![]() Domain → Surface
→ Create → Structural Point...
Domain → Surface
→ Create → Structural Point...
Create a structural point surface as follows:
(Optional) Provide a name for the structural point surface if you do not want to use the default name.
Important: The surface name that you provide must begin with an alphabetical letter. If the name of the surface begins with any other character or number, Ansys Fluent rejects the entry.
Specify the location of the point. There are three different ways to do this:
Note: The point must be in a solid cell zone. The structural model must also be enabled for the Structural Point Surface dialog box to be available (refer to Modeling Fluid-Structure Interaction (FSI) Within Fluent for additional information).
Right-click in the domain to specify the point using the mouse probe tool (you can also left-click if you click the probe button in the toolbar—
). The point tool automatically snaps to the nearest
Node or Cell Center, depending on the option
selected in the Snap on Probe Click group box.Move the point tool (
) to the location in the domain where you want the point surface
created. Refer to Using the Point Tool for additional information.Enter the coordinates (x, y, z) under Coordinates.
Click to create the new surface.
Note: Clicking moves the point tool and coordinates to the center of the current graphics window view.
If you want to check that your new surface has been added to the list of all defined surfaces, or you want to delete or otherwise manipulate any surfaces, expand the Surfaces branch in the Outline View tree (under Results). For details, see Grouping, Prioritizing, Editing, Renaming, and Deleting Surfaces.
You can create lines and rakes in the domain for releasing particles, obtaining data for comparison with tunnel data, and so on. A rake consists of a specified number of points equally spaced between two specified endpoints. A line is simply a line that extends up to and includes the specified endpoints; data points will be located where the line intersects the faces of the cell, and consequently may not be equally spaced.
To create a line or rake surface, you will use the Line/Rake Surface Dialog Box (Figure 39.10: The Line/Rake Surface Dialog Box).
![]() Domain → Surface
→ Create → Line/Rake...
Domain → Surface
→ Create → Line/Rake...
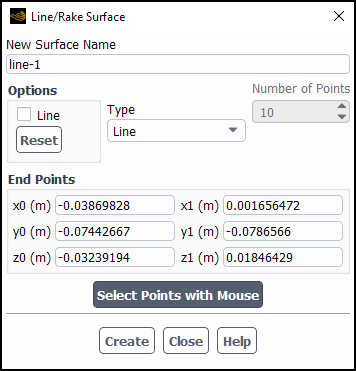
The steps for creating the line or rake surface are as follows:
Indicate whether you are creating a Line surface or a Rake surface by selecting the appropriate item in the Type drop-down list.
If you are creating a rake surface, specify the Number of Points to be equally spaced between the two endpoints.
Specify the location of the line or rake surface. There are three different ways to define the location:
Enter the coordinates of the first point (x0, y0, z0) and the last point (x1, y1, z1) under End Points.
Click and then select the endpoints by clicking on locations in the active graphics window with the mouse-probe button. (See Controlling the Mouse Button Functions for information about setting mouse button functions.)
Use the Line Tool option to interactively position a line in the graphics window. You can set the initial location of this line using one of the two methods described above for specifying endpoints (or you can start from the position defined by the default End Points). See Using the Line Tool for information about using the line tool.
Note that when you use the second or third method described above, the coordinates of the End Points are updated automatically.
If you do not want to use the default name assigned to the surface, enter a new name under New Surface Name. The default name is the concatenation of the surface type and an integer that is the new surface ID (for example,
line-5orrake-6). If the New Surface Name you enter is the same as the name of a surface that already exists, Ansys Fluent will automatically assign the default name to the new surface when it is created.Important: The surface name that you enter must begin with an alphabetical letter. If the name of the surface begins with any other character or number, Ansys Fluent rejects the entry.
Click to create the new surface.
If you want to check that the new surface has been added to the list of all defined surfaces, or you want to delete or otherwise manipulate any surfaces, click to open the Surfaces Dialog Box. See Grouping, Prioritizing, Editing, Renaming, and Deleting Surfaces for details.
The line tool enables you to interactively fine-tune the definition of a line or rake using graphics. Starting from an initial line, you can translate, rotate, and resize the line until its position, orientation, and length are as desired. For example, if you need to position a rake surface just inside the inlet to a duct, you can start with the line tool near the desired location (such as on the inlet), and translate, rotate, and resize it until you are satisfied. You may find it helpful to display mesh faces to ensure that the line tool is correctly positioned inside the domain.
Important: You must update the assignment of Probe in Preferences for the line tool to work. Select Probe for Shift RMB Drag (or similar drag + key combination) in the Navigation branch in Preferences (File > Preferences...).
Before enabling the Line Tool option, set the End Points to suitable starting values. You can enter values manually, or use the button. Often it is convenient to display the mesh for an inlet or iso-surface on or near where you want to place the line or rake surface and then select two points on that mesh to specify the initial position of the line tool. Once you have specified the appropriate End Points, enable the Line Tool option. The line tool appears in the graphics window, as shown in Figure 39.11: The Line Tool.
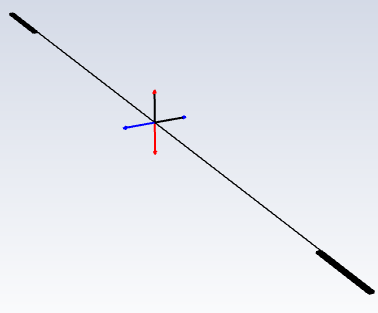
You can then translate, rotate, and/or resize the line tool as described in the following sections.
To translate the line tool in the direction along the red axis, click the mouse-probe button (the right button by default) anywhere on the “line” part of the tool and drag the mouse until the tool reaches the desired location. Green arrows will show the direction of motion For information about changing the mouse functions see Controlling the Mouse Button Functions.
Important: Do not click the axes of the line tool that have arrows on the ends. These axes control rotation of the tool. Click only on the portion of the tool that represents the prospective line surface. This portion is designated by the rectangles attached to each end.
To translate the tool in the transverse directions (that is, along either of the axes within the plane perpendicular to the red axis), press Shift, click the mouse-probe button anywhere on the "line" part of the tool, and drag the mouse until the tool reaches the desired location. Two sets of green arrows will show the possible directions of motion. In 2D, there will be only one set of green arrows because there is only one other direction for translation. If you find the perspective distracting when performing this type of translation, you can disable it in the Camera Parameters Dialog Box (opened from the Views Dialog Box), as described in Controlling Perspective and Camera Parameters.
To rotate the line tool, you click the mouse-probe button on one of the white axes with arrows. When you click one of these axes, a green ribbon will encircle the other arrowed axis, designating it as the axis of rotation. As you drag the mouse along the circle to rotate the tool, the green circle will become yellow.
Important: Do not click the red axis to rotate the line tool.
If you plan to generate a rake surface, you can resize the line tool to define the length of the rake. Click the mouse-probe button in one of the white rectangles at the ends of the "line" part of the tool (shown in black in Figure 39.11: The Line Tool) and drag the mouse to lengthen or shorten the tool. Green arrows will show the direction of stretching/shrinking.
If you "lose" the line tool, or want to reset it for any other reason, you
can either click to return the line tool to the default position
and start from there, or turn the tool off and re-initialize it as described above. In the
default position, the line tool will lie midway along the  and
and  lengths of the domain, spanning the
  domain extent.
To display flow-field data on a specific plane in the domain, you will use a plane surface. You can create surfaces that cut through the solution domain along arbitrary planes (3D cases only) and you have the option to create more than one plane at once.
There are three types of plane surfaces that you can create:
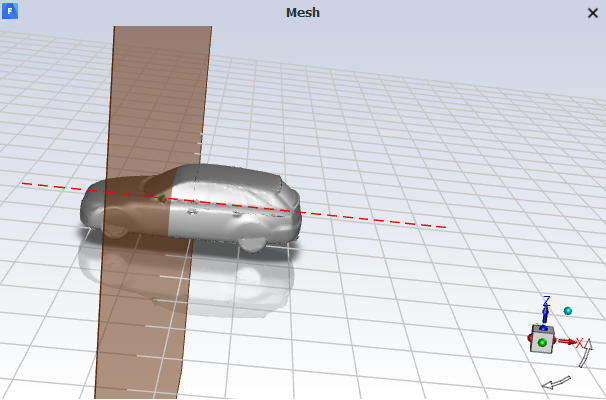
Coordinate system-based—the plane is created in the YX, ZX, or XY directions, bounded by the extents of the domain. You can move the plane to the desired location in the domain using the plane tool. For example, if you are using the YZ Plane method, you can drag the plane in the (+) or (-) X direction.
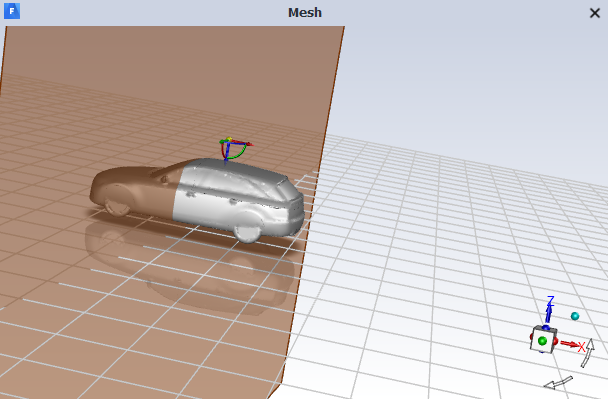
Point and normal—the plane orientation is determined by selecting a point and specifying a direction normal to that point. The extents of the plane are the edges of the domain. You have the option to control the orientation of the plane using the plane tool or you can compute the normal from a surface.
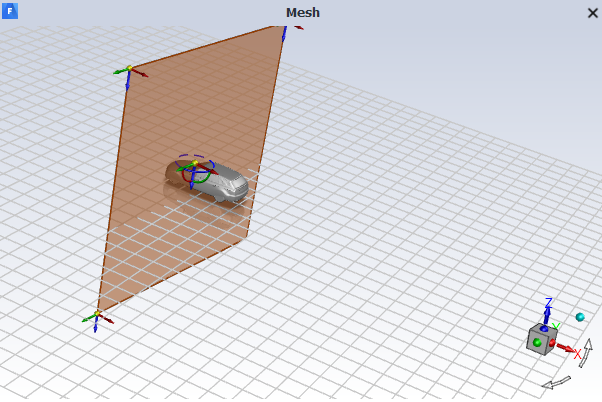
Three points—the plane orientation and extents are bounded by three points that you can select. You also have the option to manipulate the points and orientation of the plane directly in the graphics window using the plane tool.
To create a plane surface, you will use the Plane Surface Dialog Box (Figure 39.12: The Plane Surface Dialog Box).
![]() Domain → Surface
→ Create → Plane...
Domain → Surface
→ Create → Plane...
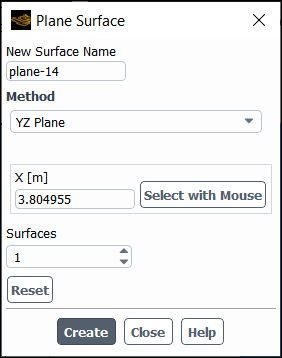
The procedure for creating the plane surface vary depending on the method you want to use.
YZ Plane, ZX Plane, or XY Plane
(Optional) Provide a name for the plane.
Important: The surface name that you enter must begin with an alphabetical letter. If the name of the surface begins with any other character or number, Ansys Fluent rejects the entry.
If you are creating more than one plane at once, the Name field is updated to Name Format with contents that look like
plane-x={x:+.6f}. This naming format results in plane names that reflect the coordinates of the plane. For example, if you create three YZ planes, with a spacing of 0.05m, starting from X=2.325m, the planes will be namedplane-x=+2.325000,plane-x=+2.375000, andplane-x=+2.425000. You can control how many significant digits are included in the plane name by varying the value represented by6in the example name format. Thefin the example name indicates that the output is a float. Changing thefto aneresults in the coordinate being represented as an exponential.Drag the plane tool to the desired location, as shown in Figure 39.13: The Plane Tool for the YZ Plane Method.
Alternatively, you can enter the coordinate that determines the location of the plane, for example the coordinate in a YZ plane. You can click to use the probe functionality (right-click) to select the third point in the graphics window.
(Optional) Increase the number of Surfaces to create more than one surface at once.
Specify the Spacing between the planes. You can either directly enter the value, or you can use the plane tool to move the planes closer or further apart.
Click .
Point and Normal
(Optional) Provide a name for the plane.
Important: The surface name that you enter must begin with an alphabetical letter. If the name of the surface begins with any other character or number, Ansys Fluent rejects the entry.
If you are creating more than one plane at once, Ansys Fluent appends an incremented value of the plane to the plane surface name. For example, if your New Surface Name is
plane-12and you are creating 3 planes with a spacing of 0.01m, the names of the planes will beplane-12=0,plane-12=0.01, andplane-12=0.02.Drag the plane tool to the desired location, as shown in Figure 39.14: The Plane Tool for the Point and Normal Method.
Alternatively, you can specify a Point (either by providing the coordinates or by clicking and selecting the point using the probe function—typically a right-click) then specify the Normal. For the Normal you can either provide the components or compute it from a surface or the view plane.
(Optional) Increase the number of Surfaces to create more than one surface at once.
Specify the Spacing between the planes. You can either directly enter the value, or you can use the plane tool to move the planes closer or further apart.
Click .
Three Points
(Optional) Provide a name for the plane.
Important: The surface name that you enter must begin with an alphabetical letter. If the name of the surface begins with any other character or number, Ansys Fluent rejects the entry.
If you are creating more than one plane at once, Ansys Fluent appends an incremented value of the plane to the plane surface name. For example, if your New Surface Name is
plane-12and you are creating 3 planes with a spacing of 0.01m, the names of the planes will beplane-12=0,plane-12=0.01, andplane-12=0.02.Drag the plane tool to the desired location, as shown in Figure 39.15: The Plane Tool for the Three Points Method.
Alternatively, you can specify Point 1, Point 2, and Point 3 (either by providing the coordinates or by clicking and selecting the points using the probe function—typically a right-click).
(Optional) You can further constrain the plane by enabling the Bounded and Sample Points options, as well as by specifying a Sample Density.
Bounded—the plane will be a bounded parallelogram where 3 of the 4 points are defined by the three points specified during creation of the plane.
Sample Points—allows you to specify a uniform distribution of data points on the plane.
Sample Density—specifies the density of points when the Sample Points option is enabled.
Edge 1, Edge2—sets the point density along the two directions of the plane. (Edge1 extends from point 0 to point 1, and edge 2 extends from point 1 to point 2.)
(Optional) Increase the number of Surfaces to create more than one surface at once.
Specify the Spacing between the planes. You can either directly enter the value, or you can use the plane tool to move the planes closer or further apart.
Click .
New surfaces are added to the Surfaces branch in the Outline View Tree.
![]() Results → Surfaces
Results → Surfaces
Refer to Grouping, Prioritizing, Editing, Renaming, and Deleting Surfaces for information on modifying existing surfaces.
The plane tool enables you to interactively fine-tune the definition of a plane using graphics. Starting from an initial plane, you can translate, rotate, and resize the plane until its position, orientation, and size are as desired. For example, if you need to position a plane surface at a cross-section of an irregularly-shaped, curved duct, you can start with the plane tool near the desired location, resize it, translate it until it is within the duct walls, and rotate it to the proper orientation. You may find it helpful to display mesh faces to ensure that the plane tool is correctly positioned inside the domain.
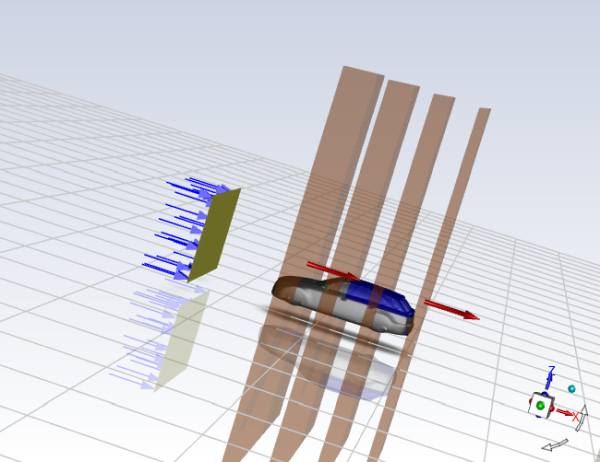
Additionally, if you increase the number of surfaces being created to more than 1, the corresponding number of planes will appear in the graphics window (as shown in Figure 39.16: The Plane Tool for Creating Multiple Planes).
The exact appearance of the plane tool depends on the Method that you select in Figure 39.12: The Plane Surface Dialog Box. The plane tool appears in the graphics window as soon as you open the Plane Surface dialog box.
The plane tool for the YZ Plane, ZX Plane, and XY Plane allows you to drag the plane along its perpendicular axis, as shown in Figure 39.13: The Plane Tool for the YZ Plane Method.
Note: You can control the size of the plane tool triad using the Graphics triad tool size field in the Graphics branch of Preferences (File>Preferences...). Note that the updated tool size only appears after restarting the Fluent application.
The plane tool for the Point and Normal method allows you to move the plane by manipulating the axis triad located in the middle of the plane, as shown in Figure 39.14: The Plane Tool for the Point and Normal Method. You can rotate on an axis, move the plane within a single axis, or "grab" the center of the axis and relocate the point (and entire plane) anywhere within the domain.
The plane tool for the Three Points method allows you to manipulate the location, orientation, and extents of the plane by manipulating the center axis triad and the axis triads located at three of the corners, as shown in Figure 39.15: The Plane Tool for the Three Points Method. Each of the axis triads can be moved along within a single plane, or moved freely by "grabbing" the center of the triad. In addition, the center axis triad can also be rotated, which moves the other three axis triads.
Increasing the number of Surfaces in the Plane Surface dialog box adds the corresponding number of planes to the graphics window. Using the tool, you can move the location of the first and last planes, with the first plane moving the location of all the planes and the final plane changing the spacing between them.
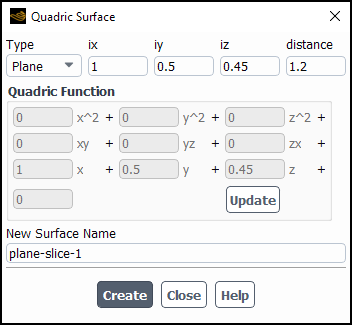
If you want to display data on a line (2D), plane (3D), circle (2D), sphere (3D), or general quadric surface, you can specify the surface by entering the coefficients of the quadric function that defines it. This feature provides you with an explicit method for defining surfaces. See Line and Rake Surfaces and Plane Surfaces for additional methods for creating line and plane surfaces.
To create a quadric surface, you will use the Quadric Surface Dialog Box (Figure 39.17: The Quadric Surface Dialog Box).
![]() Domain → Surface
→ Create → Quadric...
Domain → Surface
→ Create → Quadric...
The steps for creating the quadric surface are as follows:
Decide which type of quadric surface you want to create. In 3D, choose Plane, Sphere, or (general) Quadric in the Type drop-down list. In 2D, choose Line, Circle, or Quadric.
Specify the defining equation for the surface in SI units.
Line or plane surface: If you have selected Line (in 2D) or Plane (in 3D) as the surface type, the surface will consist of all points on the domain that satisfy the equation
 . You will specify ix (the coefficient of
 ), iy (the coefficient of
  ), iz (the coefficient of
  ), and distance (the distance of the line or plane
from the origin) in the fields to the right of the Type drop-down list.
When you click under the Quadric Function
heading, the display of the quadric function coefficients will change to reflect your
inputs.
), and distance (the distance of the line or plane
from the origin) in the fields to the right of the Type drop-down list.
When you click under the Quadric Function
heading, the display of the quadric function coefficients will change to reflect your
inputs.Circle or sphere surface: If you have selected Circle (in 2D) or Sphere (in 3D) as the surface type, the surface will consist of all points on the domain that satisfy the equation
 . You will specify x0, y0,
z0 (the
. You will specify x0, y0,
z0 (the  ,
,  , and
, and  coordinates of the sphere or circle’s center) and
r (the radius) in the fields to the right of the
Type drop-down list. When you click under
the Quadric Function heading, the display of the quadric function
coefficients will change to reflect your inputs.
coordinates of the sphere or circle’s center) and
r (the radius) in the fields to the right of the
Type drop-down list. When you click under
the Quadric Function heading, the display of the quadric function
coefficients will change to reflect your inputs.Quadric surface: If you have selected Quadric as the surface type, the surface will consist of all points in the domain that satisfy the general quadric function
 . You will specify the coefficients of the quadric function
  (the coefficients of the terms
  ,
,  ,
,  , xy, yz, zx, x, y, z and the constant term) directly in the
Quadric Function box, and you will set value to
the right of the Type drop-down list. Note that the
Update button will be disabled when you choose this type of
surface.
, xy, yz, zx, x, y, z and the constant term) directly in the
Quadric Function box, and you will set value to
the right of the Type drop-down list. Note that the
Update button will be disabled when you choose this type of
surface.
If you do not want to use the default name assigned to the surface, enter a new name under New Surface Name. The default name is the concatenation of the surface type and an integer that is the new surface ID (for example,
sphere-slice-7orquadric-slice-10). If the New Surface Name you enter is the same as the name of a surface that already exists, Ansys Fluent will automatically assign the default name to the new surface when it is created.Important: The surface name that you enter must begin with an alphabetical letter. If the name of the surface begins with any other character or number, Ansys Fluent rejects the entry.
Click to create the new surface.
If you want to check that your new surface has been added to the list of all defined surfaces, or you want to delete or otherwise manipulate any surfaces, click to open the Surfaces Dialog Box. See Grouping, Prioritizing, Editing, Renaming, and Deleting Surfaces for details.
If you want to display results on cells that have a constant value for a specified
variable, you will need to create an iso-surface of that variable. Generating an iso-surface
based on  ,
,  , or
, or  coordinate, for example, will give you an
  ,
,  , or
, or  cross-section of your domain; generating an iso-surface based on pressure will
enable you to display data for another variable on a surface of constant pressure. You can
create an iso-surface from an existing surface or from the entire domain. Furthermore, you can
restrict any iso-surface to a specified cell zone. You also have the option of creating multiple
iso-surfaces at once that are separated by a specified value.
cross-section of your domain; generating an iso-surface based on pressure will
enable you to display data for another variable on a surface of constant pressure. You can
create an iso-surface from an existing surface or from the entire domain. Furthermore, you can
restrict any iso-surface to a specified cell zone. You also have the option of creating multiple
iso-surfaces at once that are separated by a specified value.
Important:
Note that you cannot create an iso-surface until you have initialized the solution, performed calculations, or read a data file.
While an iso-surface can be created and the domain patched after the case is initialized, the patched iso-surface cannot be displayed correctly until you advance the solution for at least one iteration (alternatively, you can reopen the Iso-surface dialog box and click ).
To create an iso-surface, you will use the Iso-Surface Dialog Box (Figure 39.18: The Iso-Surface Dialog Box).
![]() Domain → Surface
→ Create → Iso-Surface...
Domain → Surface
→ Create → Iso-Surface...
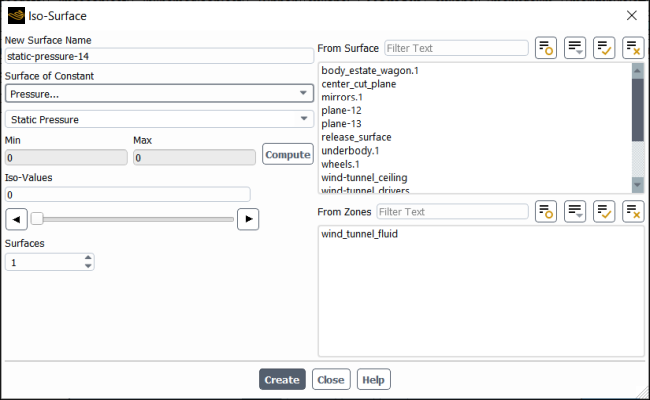
The steps for creating one or more iso-surfaces are as follows:
Choose the scalar variable to be used for isosurfacing in the Surface of Constant drop-down list. First, select the desired category in the upper list. You can then select from related quantities from the lower list. (See Field Function Definitions for an explanation of the variables in the list.)
If you want to create an iso-surface from an existing surface (that is, generate a new surface of constant
 ,
,  , temperature, pressure, and so on that is a subset of another surface),
choose that surface in the From Surface list. You can specify the cell
zone on which you want to create an iso-surface by selecting the zone in the From
Zones list.
, temperature, pressure, and so on that is a subset of another surface),
choose that surface in the From Surface list. You can specify the cell
zone on which you want to create an iso-surface by selecting the zone in the From
Zones list.If you do not select a surface from the list, the isosurfacing will be performed on the entire domain.
If you do not select a zone from the list, then the isosurfacing will not be restricted to any cell zone and will run through the entire domain.
Click to calculate the minimum and maximum values of the selected scalar field in the domain or on the selected surface (in the From Surface list). The minimum and maximum values will be displayed in the Min and Max fields.
Set the isovalue using one of the following methods. (Note that the second method will enable you to define multiple isovalues in a single iso-surface.)
You can set an iso-value interactively by moving the slider with the left mouse button. The value in the Iso-Values field will be updated automatically. This method will also create a temporary iso-surface in the graphics window. Using the slider enables you to preview an iso-surface before creating it.
Important: Even though the iso-surface is displayed, it is only a temporary surface. To create an iso-surface, use the Create button after deciding on a particular isovalue.
You can type in isovalues in the Iso-Values field directly, separating multiple values by white space. Multiple isovalues will be contained in a single iso-surface; that is, you cannot select subsurfaces within the resulting iso-surface.
(Optional) Increase the number of Surfaces to create more than one surface at once.
Specify the Spacing between the iso-surfaces.
If you do not want to use the default name assigned to the surface, enter a new name under New Surface Name. The default name is the concatenation of the surface type and an integer that is the new surface ID (for example,
z-coordinate-6). (If the New Surface Name you enter is the same as the name of a surface that already exists, Ansys Fluent will automatically assign the default name to the new surface when it is created.)Important: The surface name that you enter must begin with an alphabetical letter. If the name of the surface begins with any other character or number, Ansys Fluent rejects the entry.
If you are creating multiple iso-surfaces, the listed name is appended with the iso-value incremented by the specified spacing.
Click . The new surface name will be added to the From Surface list in the dialog box.
If you want to delete or otherwise manipulate any surfaces, click to open the Surfaces Dialog Box. See Grouping, Prioritizing, Editing, Renaming, and Deleting Surfaces for details.
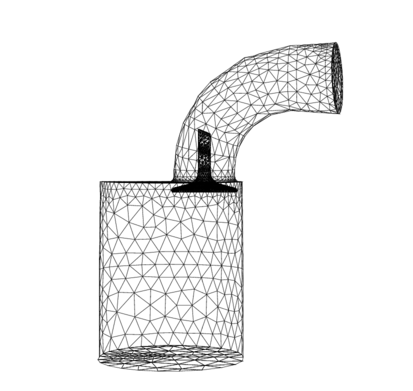
If you have created a surface, but you do not want to use the whole surface to display
data, you can clip the surface between two isovalues to create a new surface that spans a
specified subrange of a specified scalar quantity. The clipped surface consists of those points
on the selected surface where the scalar field values are within the specified range. For
example, in Figure 39.19: External Wall Surface Isoclipped to Values of x Coordinate the external wall has been clipped to
values of  coordinate less than 0 to show only the back half of the wall, enabling you to
see the valve inside the intake port.
coordinate less than 0 to show only the back half of the wall, enabling you to
see the valve inside the intake port.
Important:
Note that you cannot create an iso-clip until you have initialized the solution, performed calculations, or read a data file.
While an iso-clip can be created and the domain patched after the case is initialized, the patched iso-clip cannot be displayed correctly until you advance the solution for at least one iteration (alternatively, you can reopen the Iso-Clip dialog box and click ).
To clip an existing surface, you will use the Iso-Clip Dialog Box (Figure 39.20: The Iso-Clip Dialog Box).
![]() Domain → Surface
→ Create → Iso-Clip...
Domain → Surface
→ Create → Iso-Clip...
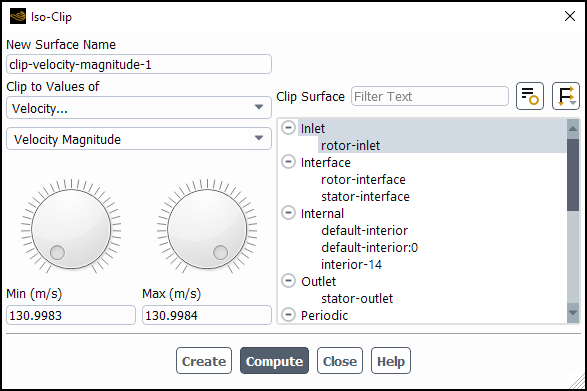
The steps for clipping a surface are as follows:
Choose the scalar variable on which the clipping will be based in the Clip to Values of drop-down list. First, select the desired category in the upper list. You can then select from related quantities from the lower list. See Field Function Definitions for an explanation of the variables in the list.
Select the surface to be clipped in the Clip Surface list.
Click to calculate the minimum and maximum values of the selected scalar field on the selected surface. The minimum and maximum values are displayed in the Min and Max fields.
Define the clipping range using one of the following methods.
You can set the upper and lower limits of the clipping range interactively by moving the indicator in each dial (that is, the dial above the Min or Max field) with the left mouse button. The value in the corresponding Min or Max field is updated automatically. This method will also create a temporary surface in the graphics window. Using the dials enables you to preview a clipped surface before creating it.
Important:Even though the clipped surface is displayed, it is only a temporary surface. Click to create the new surface after deciding on the clipping range.
Iso-clipping uses cell-center values. Therefore, if an iso-clip includes a wall boundary, there may be a discrepancy between the value of a quantity at the wall surface (which is a face value) and the value shown for the iso-clip.
You can type the minimum and maximum values in the clipping range directly in the Min and Max fields.
If you do not want to use the default name assigned to the surface, enter a new name under New Surface Name. The default name is the concatenation of the surface type and an integer that is the new surface ID (for example,
clip-density-8). (If the New Surface Name you enter is the same as the name of a surface that already exists, Ansys Fluent will automatically assign the default name to the new surface when it is created.)Important: The surface name that you enter must begin with an alphabetical letter. If the name of the surface begins with any other character or number, Ansys Fluent rejects the entry.
Click . The new surface name is added to the Clip Surface list in the dialog box. (The original surface will remain unchanged.)
If you want to delete or otherwise manipulate any surfaces, click to open the Surfaces Dialog Box. See Grouping, Prioritizing, Editing, Renaming, and Deleting Surfaces for details.
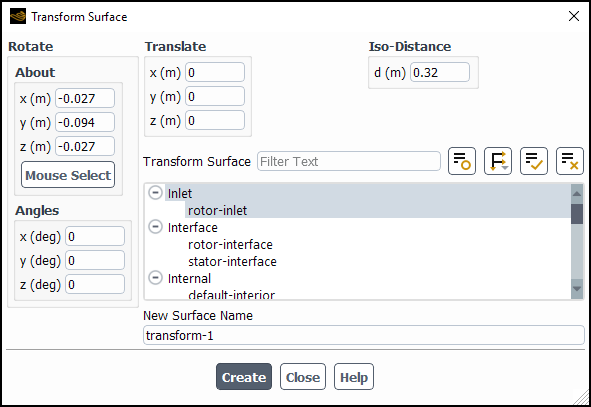
You can create a new data surface from an existing surface by rotating and/or translating the original surface. For example, you can rotate the surface of a complicated turbomachinery blade to plot data in the region between blades. You can also create a new surface at a constant normal distance from the original surface.
To transform an existing surface to create a new one, you will use the Transform Surface Dialog Box (Figure 39.21: The Transform Surface Dialog Box).
![]() Domain → Surface
→ Create → Transform...
Domain → Surface
→ Create → Transform...
The steps for transforming a surface are as follows:
Select the surface to be transformed in the Transform Surface list.
Important: The transform operation is not available for user-created surfaces such as lines, points, iso-surfaces, and so on. To create a transformed line, point, iso-surface, or other user-created surface, you must manually translate the input point(s) and create a new line/point/iso-surface in the respective dialog box (Line/Rake, Point Surface, Iso-Surface, and so on).
Set the appropriate transformation parameters, as described below. You can perform any combination of translation, rotation, and “isodistancing” on the surface.
Rotation: To rotate a surface, specify the origin about which the surface is rotated, and the angle by which the surface is rotated.
In the About box under Rotate, specify a point, and the origin of the coordinate system for the rotation will be set to that point. (The
 ,
,  , and
, and  directions will be the same as for the global coordinate system.) For
example, if you specified the point (1,5,3) in 3D, rotation would be about the
directions will be the same as for the global coordinate system.) For
example, if you specified the point (1,5,3) in 3D, rotation would be about the
 ,
,  , and
, and  axes anchored at (1,5,3). You can either enter the point’s
coordinates in the x, y, and
z fields or click and select a
point in the graphics window using the mouse-probe button. See Controlling the Mouse Button Functions for information about mouse button functions.
axes anchored at (1,5,3). You can either enter the point’s
coordinates in the x, y, and
z fields or click and select a
point in the graphics window using the mouse-probe button. See Controlling the Mouse Button Functions for information about mouse button functions.In the Angles box under Rotate, specify the angles about the
 ,
,  , and
, and  axes (that is, the axes of the coordinate system with the origin defined
under About) by which the surface is rotated. For 2D problems, you can
specify rotation about the
axes (that is, the axes of the coordinate system with the origin defined
under About) by which the surface is rotated. For 2D problems, you can
specify rotation about the  axis only.
Translation: To translate a surface, define the distance by which the surface is translated in each direction. Set the x, y, and z translation distances under Translate.
Isodistancing: To create a surface positioned at a constant normal distance around the original surface, set the value for d under Iso-Distance.
If you do not want to use the default name assigned to the surface, enter a new name under New Surface Name. The default name is the concatenation of the surface type and an integer that is the new surface ID (for example,
transform-9). If the New Surface Name you enter is the same as the name of a surface that already exists, Ansys Fluent will automatically assign the default name to the new surface when it is created.Important: The surface name that you enter must begin with an alphabetical letter. If the name of the surface begins with any other character or number, Ansys Fluent rejects the entry.
Click . The new surface name is added to the Transform Surface list in the dialog box. The original surface will remain unchanged.
If you want to delete or otherwise manipulate any surfaces, click to open the Surfaces Dialog Box. See Grouping, Prioritizing, Editing, Renaming, and Deleting Surfaces for details.
Expression volumes allow you to visualize a subset of the domain constrained according to your provided criteria. They can also be used to define a surface or volume that can be used in computing surface and volume reports and report definitions. Expression volumes can behave as either a surface or a volume, depending on the context. For example, an expression volume used in a contour plot is represented as a surface. That same volume used in a volume report definition is treated as a volume.
There are two primary methods for creating volume surfaces:
Using the relevant cell register dialog box (Using Cell Registers)
Note: Expression volumes created using the Create Volume Surface option in a cell register dialog box are equivalent to those created by opening Figure 39.22: The Expression Volume Dialog Box, selecting a cell register from the drop-down list and clicking Create. You can confirm this by reviewing the definition of a volume surface created using the Create Volume Surface option (listed under Surfaces in the Outline View tree).
Using the Expression Volumes dialog box (Fluent Expressions Language)
To create a volume surface:
Read a data file or initialize the solution.
 File → Read
→ Data...
File → Read
→ Data...or
Solution → Initialization
→ Initialize(Cell register-based volume) Create a cell register that defines the desired volume:
Right-click Cell Registers in the Outline View tree and create a new cell register of the desired type.
 Solution → Cell Registers
 New → <cell register
type...>
New → <cell register
type...>Enable the Create Volume Surface option prior to saving the register.
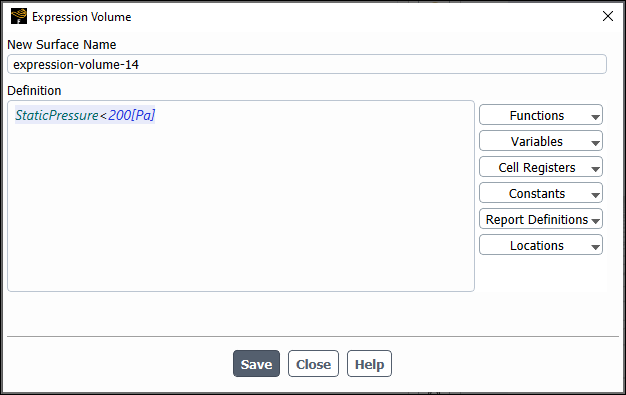
Open the Expression Volume dialog box.
Results → Surfaces
New
→ Expression-Volume...Enter the desired expression definition. For example,
StaticPressure<200[Pa].Click to create the volume.
You can display volume you just created by right-clicking it in the Outline View tree and selecting Display. It is also available for selection in the Surfaces list of various postprocessing graphics objects, such as mesh, contour and vector plots.
Results → Surfaces
→ <volume name>
Display
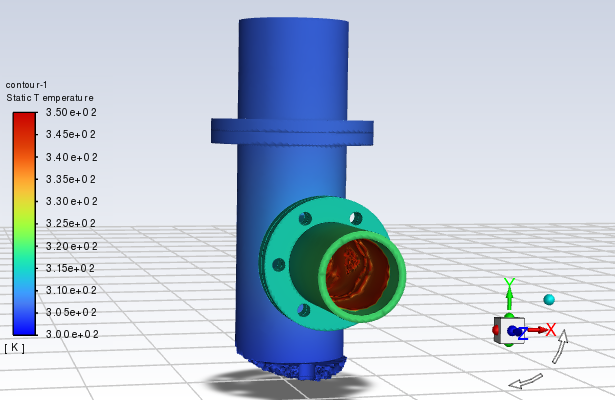
Important: Visualizing a volume surface with the same variable used to mark the cells for creating the surface may result in values being displayed that are outside of the range used to create the surface.
For example, an expression volume for temperature iso-values in the range of 305K to 345K can result in the image as shown in Figure 39.23: Example Temperature Contour on Volume Surface. The temperature contour plot shows a range of 300K to 350K.
There are two separate but related entities involved in this example. There is the expression volume, which is created using cell-center values. Then, there is the expression volume surface, which is made available for visualization purposes. The values on this surface are interpolated from the cell-center values, leading to the differences seen in the example.
Once you have created a number of surfaces, you can edit, rename, delete, and group surfaces and obtain information about their components. Grouping surfaces is useful if you want to perform postprocessing on a number of surfaces at a time. For example, you may want to group several wall surfaces together to generate a contour plot of temperature on all walls. To postprocess results on each wall surface individually, “ungroup” the surfaces.
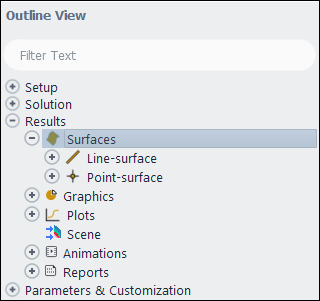
You can manipulate existing surfaces and create new ones through the Surfaces branch of the Outline View.
![]() Results → Surfaces
Results → Surfaces
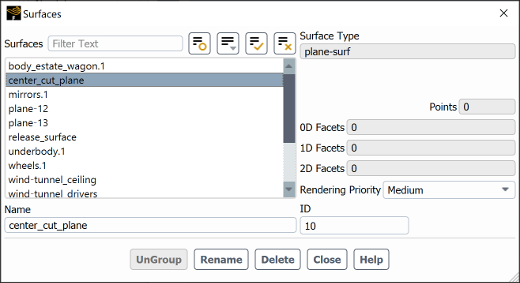
Additionally, you can manipulate existing surfaces within the Surfaces Dialog Box (Figure 39.24: The Surfaces Dialog Box).
![]() Domain → Surface
→ Manage...
Domain → Surface
→ Manage...
You can also open this dialog box by clicking in one of the surface creation dialog boxes described in the previous sections or by double-clicking the Surfaces branch in the Outline View.
For additional information, see the following sections:
As mentioned above, you may want to group several surfaces together in order to perform postprocessing on all of them at once. To create a surface group, select the surfaces to be grouped in the Surfaces list. You can define a new name for the group in the Name field, or you can use the default name, which is the name of the first surface you selected in the Surfaces list. Then click . The selected surfaces disappear from the Surfaces list, and the name of the surface group is added to the list.
Important: The Group button will not appear until you have selected at least two surfaces. As soon as you choose a second surface in the Surfaces list, the Rename button will change to the Group button.
To ungroup the surfaces, simply select the surface group in the Surfaces list and click . The group name will disappear from the list and the names of the original surfaces in the group will reappear in the list.
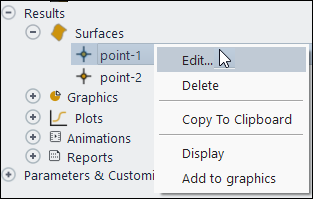
You can edit surfaces either by double-clicking the surface in the Surfaces branch of the Outline View or by right-clicking it and selecting Edit.... This opens the respective surface dialog box where you can modify settings and rename the surface.
![]() Results → Surfaces
Results → Surfaces
![]() <surface-name>
→ Edit...
<surface-name>
→ Edit...
To change the name of an existing surface, select the surface in the Surfaces list of the Surfaces dialog box, enter a new name in the Name field, and then click . The new name replaces the old name in the Surfaces list and the surface is otherwise unchanged.
If you select more than one surface, the button will not appear in the dialog box. When more than one surface is selected, the button is replaced by the button.
Important: The surface name that you enter must begin with an alphabetical letter. If the name of the surface begins with any other character or number, Ansys Fluent rejects the entry.
In some instances you may observe a graphical anomaly when viewing one or more postprocessing objects such as mesh or contour plots in the graphics window. It could appear as a "checkerboard" like effect or as missing pixels, or similar. This type of display issue is often referred to as "z-fighting", "depth buffer", or "plane fighting" and it occurs when Fluent is trying to display multiple things at two or more coincident surfaces, such as shown in Figure 39.25: Example of Z-fighting. Note that mesh objects take a lower priority to all other graphics objects.
To specify a surface rendering priority:
Select one or more Surfaces.
Select the desired priority from the Rendering Priority drop-down list.
The updated priority is saved as soon as you complete the selection.
Note: Surface rendering priority is not applied to the global mesh display (which is accessed
via the mesh display toolbar button ![]() ; it is also used for the default mesh display if Display Mesh
After Reading is enabled when you read your case).
; it is also used for the default mesh display if Display Mesh
After Reading is enabled when you read your case).
If you find that a surface is no longer useful, you may want to delete it to prevent the list of surfaces from becoming too cluttered. Select the surface or surfaces to be deleted in the Surfaces list, and then click . The delete operation is not reversible, so if you want to get a deleted surface back again you will need to recreate it using one of the surface-creation dialog boxes described in the previous sections.
You can also use the Surfaces Dialog Box to retrieve topological information about surfaces. Points is the total number of nodes in a surface. 0D Facets is the number of isolated nodes in a surface (that is, nodes that have no connectivity, such as point surfaces or nodes in a rake), 1D Facets is the number of linear faces (consisting of two connected nodes) in a surface in a 2D problem, and 2D Facets is the number of 2D faces (triangular or quadrilateral) in a surface in a 3D problem. Note that an interior zone surface in a 3D problem consists of 2D facets, and similarly an interior zone surface in a 2D problem consists of 1D facets.
These statistics are listed for the surface(s) selected in the Surfaces list. If more than one surface is selected, the sum over all selected surfaces is displayed for each quantity.
Note that if you want to check these statistics for a surface that was read from a case file, you will need to first display it.