


Cell registers are a means for marking cells based on certain criteria, such as iso-values or proximity to a boundary. You can then use these marked cell registers to perform operations like refining or coarsening the mesh (Adapting the Mesh), patching the solution (Patching Values in Selected Cells), or deleting cells (Deleting Cells). You can also create a volume from the cell register that you can then use for visualization in applications such as postprocessing (Expression Volumes).
The following sections describe how to create and use cell registers:
Note:
If you have multiple cell registers that you want to display within the same graphics window, you can enable the Overlays option in the Scene Description dialog box (accessed by clicking Compose... in the View ribbon tab). With this option enabled, each subsequent cell register you display is shown on top of the existing graphics window display.
(Parallel only) The exact number of cells in a register may vary between sessions running on different core counts for the same case. However, any cell count variations are not to a degree that they could impact the results.
You can only define a maximum of 16 cell registers.
Region registers allow you to mark cells inside or outside of a given region that you can specify using text or mouse inputs. Using text input, you can specify the region as a hexahedron (quadrilateral in 2D), a sphere (circle in 2D), or a cylinder.
The basic approach to creating a region cell register is to first define a region:
The hexahedron (quadrilateral) is defined by entering the coordinates of two points defining the diagonal.
The sphere (circle) is defined by entering the coordinates of the center of the sphere and its radius.
To define a cylinder, specify the coordinates of the points defining the cylinder axis, and the radius. In 3D this will define a cylinder. In 2D, you will have an arbitrarily oriented rectangle with length equal to the cylinder axis length and width equal to the radius.
A rectangle defined using the cylinder option differs from one defined with the quadrilateral option in that the former can be arbitrarily oriented in the domain, while the latter must be aligned with the coordinate axes.
You can either enter the exact coordinates into the appropriate real entry fields or select the locations with the mouse on displays of the mesh or solution field. After the region is defined, each cell that has a centroid inside/outside the specified region is marked.
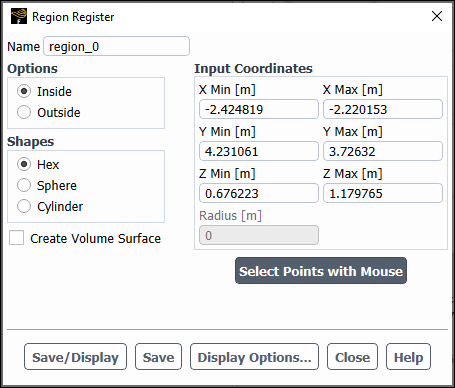
To create a region cell register:
Open the Figure 39.26: Region Register Dialog Box.
 Solution → Cell Registers
 New → Region...
 Specify whether the register includes cells Inside or Outside of the defined region.
If you choose Inside, cells with centroids within the specified region will be marked.
If you choose Outside, cells with centroids outside the specified region will be marked.
Choose the shape for the region register.
In 2D, you may specify a Quad (that is, a quadrilateral), Circle, or Cylinder by making a selection from the Shapes group box. In 3D, your options include Hex (that is, a hexahedron), Sphere, or Cylinder.
Define the region by entering values into the dialog box or by using the mouse.
In the dialog box, the inputs are as follows:
To define a hexahedron or quadrilateral, enter the coordinates of two points defining the diagonal of the box.
For a hexahedron, define X Min, Y Min, and Z Min, as well as X Max, Y Max, and Z Max. For a quadrilateral, define X Min and Y Min, as well as X Max and Y Max.
To define a sphere or circle, enter the values for the Radius and the coordinates of its center: X Center, Y Center, and Z Center for a sphere, or X Center and Y Center for a circle.
To define a cylinder, enter the value for the Radius and the minimum and maximum coordinates defining the cylinder axis: X-Axis Min, Y-Axis Min, and Z-Axis Min, as well as X-Axis Max, Y-Axis Max, and Z-Axis Max for 3D, or X-Axis Min and Y-Axis Min, as well as X-Axis Max and Y-Axis Max for 2D. In 2D, this will be the width of the resulting rectangle.
To define the region using the mouse, click the button. Using the right mouse button, select the input coordinates from a display of the mesh or solution field. After selecting the points, the values will be loaded automatically into the appropriate fields in the dialog box. See Controlling the Mouse Button Functions for details about mouse button functions.
You have the option of editing these values before marking .
To define a hexahedron or quadrilateral, select the two points of the diagonal in any order.
To define a sphere or circle, first select the location of the centroid and then select a point that lies on the sphere/circle (that is, a point that is one radius away from the centroid).
To define a cylinder, first select the two points that define the cylinder axis and then select a point that is one radius away from the axis.
(Optional) Enable Create Volume Surface to create a volume "surface" that can be selected for visualization in graphics objects such as mesh and contour plots.
Click to create the cell register.
Note: You can change the way the register is displayed by using the Cell Register Display Options Dialog Box dialog box that opens by clicking Display Options....
Boundary registers allow you to mark cells within the proximity of a boundary. The proximity to the boundary can be based on:
cell distance—the distance of a cell from the boundary is measured by the number of cells.
volume distance—the distance is based on a target boundary volume and growth factor.
Cells are marked based on the following equation:

(39–1)
where
 is the cell volume,
  is the specified boundary volume (Boundary Volume),
 is the exponential growth factor (Growth Factor), and
 is the normal distance of the cell centroid from the selected boundaries.
 is the target volume for a cell.
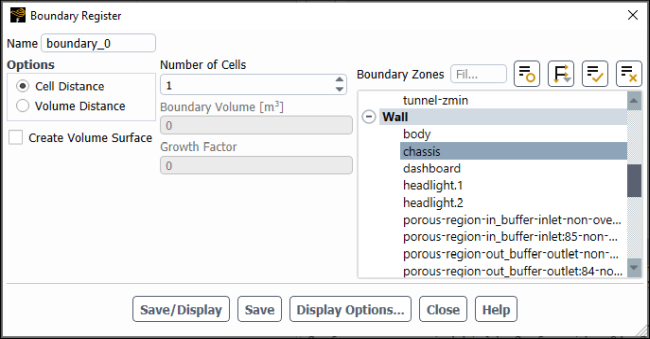
To create a boundary cell register:
Open the Figure 39.27: Boundary Register Dialog Box.
Solution → Cell Registers
New → Boundary... Choose whether the boundary register is based on Cell Distance or Volume Distance.
Specify the Number of Cells or Boundary Volume and Growth Factor, depending on which distance method you selected in the previous step.
Select the boundary zone(s) for the cell register.
(Optional) Enable Create Volume Surface to create a volume "surface" that can be selected for visualization in graphics objects such as mesh and contour plots.
Click to create the cell register.
Note: You can change the way the register is displayed by using the Cell Register Display Options Dialog Box dialog box that opens by clicking Display Options....
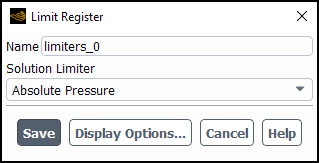
Limit registers allow you to mark the cells that have reached a solution limit while solving. These limits can be viewed and modified in Figure 36.13: The Solution Limits Dialog Box. For additional information on solution limits, see Setting Solution Limits.
To create a limit cell register:
Open the Figure 39.28: Limit Register Dialog Box.
Solution → Cell Registers
New → Variable Limiter... Select the variable for creating the cell register.
Click to create the cell register.
Note: You can change the way the register is displayed by using the Cell Register Display Options Dialog Box dialog box that opens by clicking Display Options....
Field variable registers allow you to mark cells based on the value of a field variable. Additionally, you can specify if these field variable values are derived, and if so, whether it is via gradient, curvature, or Hessian-based error indicator. You can also scale the values by the zonal or global average or maximum. You can mark cells based on the minimum/maximum value of a field variable, with values below or above a certain field variable value, within a certain percentage of the minimum/maximum value of a field variable, inside or outside of a certain range of field variable values, inside or outside of a certain range defined in terms of the standard deviation, or with values below or above a limit defined in terms of the standard deviation.
There are four approaches for using the available physical features of the flow field to mark cells available in Ansys Fluent:
Gradient approach: In this approach, Ansys Fluent multiplies the Euclidean norm of the gradient of the selected solution variable by a characteristic length scale [36]. For example, the gradient function in two dimensions has the following form:

(39–2)
where
 is the error indicator,
  is the cell area,
  is the gradient volume weight, and
  is the Euclidean norm of the gradient of the desired field variable,
 .
.The default value of the gradient volume weight is unity, which corresponds to full volume weighting. A value of zero will eliminate the volume weighting, and values between 0 and 1 will use proportional weighting of the volume.
This approach is recommended for problems with strong shocks, for example, supersonic inviscid flows.
Curvature approach: This is an equidistribution marking technique that multiplies the undivided Laplacian of the selected solution variable by a characteristic length scale [168].
For example, the gradient function in two dimensions has the following form:

(39–3)
where
 is the error indicator,
  is the cell area,
  is the gradient volume weight, and
  is the undivided Laplacian of the desired field variable (
 ).
).The default value of the gradient volume weight is unity, which corresponds to full volume weighting. A value of zero will eliminate the volume weighting, and values between 0 and 1 will use proportional weighting of the volume.
This approach is recommended for problems with smooth solutions.
Hessian approach: This calculates a Hessian-based error indicator for a field variable, which can be useful when creating a cell register to use as part of mesh adaption for an external aerodynamic simulation (as described in Aerodynamics Adaption). The indicator is based on the relationship between the second derivatives of the solution and the local interpolation error expanded around a point [59].

(39–4)
where
 is the exact solution,
  is the approximate solution and
  is the Hessian matrix composed of second derivatives. This key idea has
seen widespread use due to the capability of detecting a variety of flow features at various
scales and strengths [7], [8], [126]. This allows adaption to effectively target accuracy improvements at
reduced computational cost.
is the Hessian matrix composed of second derivatives. This key idea has
seen widespread use due to the capability of detecting a variety of flow features at various
scales and strengths [7], [8], [126]. This allows adaption to effectively target accuracy improvements at
reduced computational cost. Isovalue approach: This approach is not based on derivatives. Instead, the isovalues of the required field variable
 , are used to control the marking. Therefore, the function is of the
form:
, are used to control the marking. Therefore, the function is of the
form:
(39–5)
where
 is the error indicator. This approach is recommended for problems where
derivatives are not helpful. For example, if you want to mark the mesh where the reaction is
taking place, you can use the isovalues of the reaction rate and mark at high reaction rates.
This approach also allows you to customize the criteria for controlling the marking using
custom field functions, user-defined scalars, and so on
is the error indicator. This approach is recommended for problems where
derivatives are not helpful. For example, if you want to mark the mesh where the reaction is
taking place, you can use the isovalues of the reaction rate and mark at high reaction rates.
This approach also allows you to customize the criteria for controlling the marking using
custom field functions, user-defined scalars, and so on
Any of the field variables available for contours display can be used in the marking cell gradients. These scalar functions include both geometric and physical features of the numerical solution. Therefore, in addition to traditional marking based on physical features, such as the velocity, you may choose to mark to the cell volume field to reduce rapid variations in cell volume.
In addition to the standard (no normalization) approach available in Ansys Fluent, four options are available for normalization [49]:
Scale by Global Average, scales the values of
 ,
,  , or
, or  by their average value in the domain, that is:
(39–6)
Scale by Zone Average scales the values of
, , or by their average value in each zone.Scale by Global Maximum, scales the values of
 ,
,  , or
, or  by their maximum value in the domain, therefore always returning a
problem-independent range of [0, 1] for any variable used for marking, that is:
by their maximum value in the domain, therefore always returning a
problem-independent range of [0, 1] for any variable used for marking, that is:
(39–7)
Scale by Zone Maximum, scales the values of
, , or by their maximum value in each zone, therefore always returning a
problem-independent range of [0, 1] for any variable used for marking.
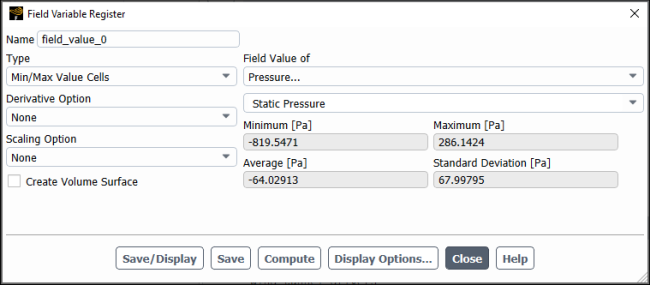
To create a field variable cell register:
Open the Figure 39.29: Field Variable Register Dialog Box.
Solution → Cell Registers
New → Field Variable... Enter an appropriate Name for the cell register.
Specify how the field variable values are derived in the Derivative Option drop-down. You can choose from:
None
Gradient
Curvature
Hessian
Note: When using the Hessian derivative option, it is recommended that you also select Scale by Global Average from the Scaling Option drop-down list, as they are relative values that are scaled based on the local mesh size.
Specify how the field variable values are scaled in the Scaling Option drop-down. You can choose from:
None
Scale by Global Average
Scale by Zone Average
Scale by Global Maximum
Scale by Zone Maximum
Select the field variable for creating the cell register from the Field Values of drop-down lists. The name of this field will change based on the selections you make for derivative and scaling options.
Choose the Type of field variable register and define the related fields. Note that you can use to calculate the minimum value, maximum value, average value, and standard deviation from the average value of the selected field variable, as well as any resulting range minimum, range maximum, and limit. Your options include:
Min/Max Value Cells
Cells containing the minimum and maximum values of the specified field variable will be marked.
Cells Less Than
Cells with values that are less than the specified threshold value will be marked.
Cells More Than
Cells with values that are greater than the specified threshold value will be marked.
Top Value Cells
Cells with values within the top 'n' percent will be marked.
Low Value Cells
Cells with values within the lowest 'n' percent will be marked.
Cells Inside Range
Cells with isovalues / gradient values / curvature values / Hessian values between your specified minimum and maximum will be marked.
Cells Outside Range
Cells with isovalues / gradient values / curvature values / Hessian values outside of your specified minimum and maximum will be marked.
Cells Inside Standard Deviation Range
Cells with values within a range defined in terms of the standard deviation will be marked. You define the Lower Limit Factor and Upper Limit Factor. These factors are then multiplied with the computed Standard Deviation, and then that product is added to the computed Average to define the Range Minimum and Range Maximum, respectively.
Cells Outside Standard Deviation Range
Cells with values outside of a range defined in terms of the standard deviation will be marked. You define the Lower Limit Factor and Upper Limit Factor. These factors are then multiplied with the computed Standard Deviation, and then that product is added to the computed Average to define the Range Minimum and Range Maximum, respectively.
Cells Less Than Standard Deviation Limit
Cells with values less than a limit defined in terms of the standard deviation will be marked. You define the Limit Factor. This factor is then multiplied with the computed Standard Deviation, and then that product is added to the computed Average to define the Limit.
Cells More Than Standard Deviation Limit
Cells with values greater than a limit defined in terms of the standard deviation will be marked. You define the Limit Factor. This factor is then multiplied with the computed Standard Deviation, and then that product is added to the computed Average to define the Limit.
(Optional) Enable Create Volume Surface to create a volume "surface" that can be selected for visualization in graphics objects such as mesh and contour plots.
Click to create the cell register.
Note: You can change the way the register is displayed by using the Cell Register Display Options Dialog Box dialog box that opens by clicking Display Options....
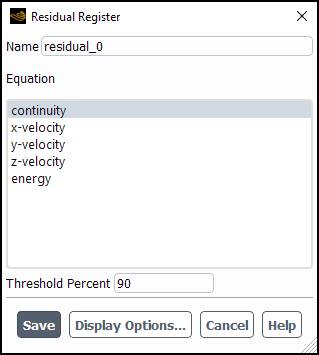
Residual registers allow you to mark cells based on their residuals values. You can visualize the cells with the highest residual values and know their location so that you can modify them as necessary.
Note: Residual registers are only available for the pressure-based numerical solver.
To create a residual cell register:
Open the Figure 39.30: Residual Register Dialog Box.
Solution → Cell Registers
New → Residuals... Select the Equation(s) for creating the residual cell register.
Specify the Threshold Percent for creating the residual cell register. Cells with residual values above this threshold for the selected equations are marked.
Click to create the cell register.
Note: You can change the way the register is displayed by using the Cell Register Display Options Dialog Box dialog box that opens by clicking Display Options....
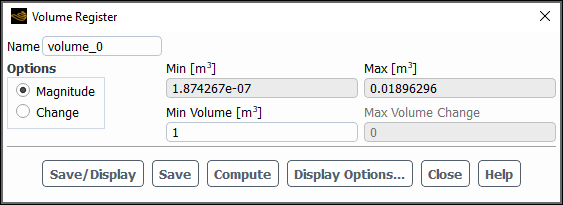
Volume registers allow you to mark cells based on the volume of the cells, either the magnitude or the change in volume.
Marking the mesh based on volume magnitude is often used to identify large cells. The procedure is to mark cells with a volume greater than the specified threshold volume.
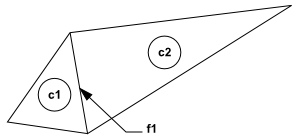
Marking the mesh based on the change in cell volume is used to identify areas where you may want to improve the smoothness of the mesh. The procedure is to mark any cell that has a volume change greater than the specified threshold value. The volume change is computed by looping over the faces and comparing the ratio of the cell neighbors to the face.
For example, in Figure 39.31: Volume Change—Ratio of the Volumes of the Cells the ratio of V1/V2 and the ratio of V2/V1 is compared to the threshold value. If V2/V1 is greater than the threshold, then C2 is marked.
To create a volume cell register:
Open the Figure 39.32: Volume Register Dialog Box.
Solution → Cell Registers
New → Volume... Choose whether the cell register is based on the minimum size of the cells (Magnitude) or the Change in volume of the cells.
Specify the Min Volume or Max Volume Change. Note that you can click to compute the minimum and maximum cell volumes.
Click to create the cell register.
Note: You can change the way the register is displayed by using the Cell Register Display Options Dialog Box dialog box that opens by clicking Display Options....
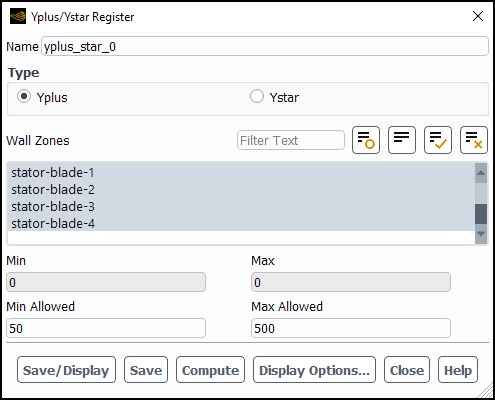
Yplus/Ystar registers allow you to mark cells based on their Yplus/Ystar values.
The approach is to compute  or
or  for boundary cells on the specified viscous wall zones, define the minimum
and maximum allowable
for boundary cells on the specified viscous wall zones, define the minimum
and maximum allowable  or
or  , and mark the appropriate cells. Cells with
  or
or  values below the minimum allowable threshold will be marked, as will cells
with
values below the minimum allowable threshold will be marked, as will cells
with  or
or  values above the maximum allowable threshold.
Figure 39.33: Airfoil Wall Cells Marked by Y+ Values shows a mesh created to solve the
flow over an airfoil, where the bottom boundary of the mesh that is shown is the top surface of
the airfoil. After an initial solution, it was determined that  values of some of the cells on the top surface were too large, and
 was used to mark them.

To create a Yplus/Ystar cell register:
Open the Figure 39.34: Yplus/Ystar Register Dialog Box.
Solution → Cell Registers
New → Yplus/Ystar... Choose whether the cell register is based on Yplus or Ystar values.
Select the Wall Zones for the Yplus or Ystar calculations.
Specify the minimum and maximum Yplus/Ystar values allowed. Note that clicking calculates the minimum and maximum Yplus/Ystar values.
Click to create the cell register.
Note: You can change the way the register is displayed by using the Cell Register Display Options Dialog Box dialog box that opens by clicking Display Options....
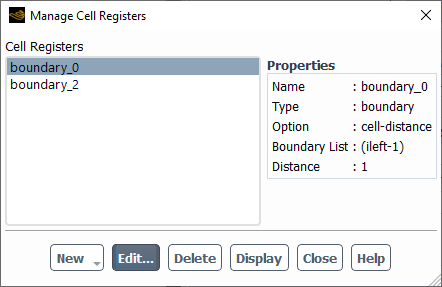
The Figure 39.35: Manage Cell Registers Dialog Box allows you to review the properties of the currently defined cell registers. You can also use it to display and delete the selected cell register, as well as to create new cell registers.
To manage cell registers:
Open the Figure 39.35: Manage Cell Registers Dialog Box.
Solution → Cell Registers
Edit... Select an existing cell register to view its properties, display it, edit it, or delete it; or create a new cell register by clicking the button and making a selection from the menu that opens.
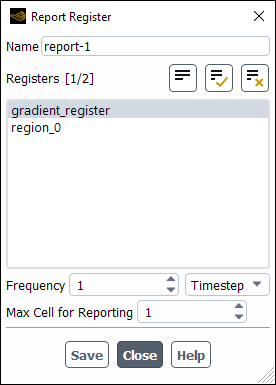
Once a cell register is defined, you can create a cell register operation to report the residual values of the selected cell registers at the interval you specify.
To create a register report:
Open the Figure 39.36: Report Register Dialog Box.
Solution → Calculation
Activities → Cell Register
Operations New Report... Note that this dialog box is only available after you have defined a cell register.
Select the cell register(s) you want included in the report.
Specify the reporting Frequency.
Specify the maximum number of cells to include in the report.
Click to create the cell register report.
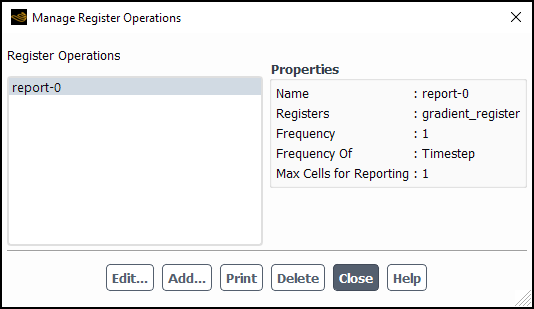
The Figure 39.37: Manage Register Operations Dialog Box allows you to view properties, create, modify, and delete report registers.
![]() Solution → Calculation
Activities → Cell Register
Operations
Solution → Calculation
Activities → Cell Register
Operations![]() Edit...
Edit...
The procedures for copying a cell register is as follows:
In the Outline View, right-click the name of a cell register that you want to copy (under Setup/Solution/Cell Registers) and select Copy... to open the corresponding register dialog box.
Enter the new name in the Name field and click Save/Display.
A new register will be added under the Cell Registers branch in the Outline View.
This is useful if you want to create a cell register with similar properties.
To change the name of a register:
In the Outline View, select the cell register you want to rename. It becomes highlighted.
Click the highlighted name again or press F2 to enter the edit mode.
Type the new name and click outside of the name field to save it.
Alternatively, you can open the cell register dialog box, change the name, and click .
This procedure is similar to changing file names in Windows Explorer.