


Failure Mode and Effects Analysis (FMEA) is an analytic method to find weaknesses in a design early and to increase the quality and reliability of the system. Ansys medini analyze directly supports the application of FMEA and a subsequent criticality analysis (FMECA) to all system- and design models based on SysML. Any structural and behavioral element in a SysML model can be augmented with failures (e.g. failure modes, malfunctions) that appears in the analysis.
The FMEA in Ansys medini analyze is designed to support a number of different FMEA standards such as VDA-AIAG, SAE J1739, MIL-STD-1629A, or IEC 60812. The tool supports Design FMEA (DFMEA), Process FMEA (PFMEA), and FMEA for Monitoring and System Response (FMEA-MSR). In addition, the configuration can be used to tailor the FMEA based on corporate customizations.
For the Failure Modes, Effects and Diagnostic Analysis (FMEDA) as well as the specific Single-Point Fault (SPF) and Latent Fault (LF) HW Architectural metrics of ISO 26262 please refer to FMEDA and Diagnostic Coverage Metrics.
The fundamental concept for the FMEA is the failure net that determines the causes and effects of a potential failure of an element. Whether these causes and effects are located in a failure collection or in another model, is up to the available models, project constraints, and users choice. From a worksheet perspective, the FMEA shows a part of the whole failure net at a certain level as a view, so any editing in a worksheet editor will always update the relations in the model (see also Safety Analysis Overview for general remarks in the failure concepts and Working with the failure net for more details).
Each FMEA worksheet is intended to describe a certain scope of analysis, i.e. a certain function, set of functions, process activity, (sub-) system, component, or element. The SysML model defines the structure of the worksheet, i.e. it shows hierarchically contained elements of the underlying model. This is also true for Process FMEAs where the model is an activity/flow model. Filtering can be applied to tailor this view.
The FMEA worksheet then shows the list of potential failures of the elements and their immediate causes and effects. In other words, it shows the next higher level effect and the causes at the next lower level. For example, a System FMEA with component failures modes can be linked to malfunctions of a logical architecture (or hazard analysis) and a more detailed HW model based on a Bill of Material (BOM).
Beside the failures, causes, effects, and design controls from a model that show up in the FMEA this is also true for the risk parameters (severity, occurrence, detection) as well as failure rates used in a criticality analysis. See Derivation of FMEA Worksheets from SysML and Executing the FMEA for more details.
The FMEA component is highly configurable regarding risk parameters and criticality assessment. The setup of default risk parameters for Severity, Occurrence, Detection as well as Frequency, and Monitoring (for VDA-AIAG) can be configured in the project settings for all FMEAs in a project:
Open the Project Settings via the context menu on a project or the top menu "Project"
Go to the FMEA tab and select Risk Classification
The settings page provides five horizontal tabs: Severity Ranking, Occurrence Ranking, Detection Ranking, Frequency Ranking, and Monitoring Ranking
The individual parameter tabs provides a list for risk values, labels, descriptions, and default values
a) The value ranges are limited between [0..10] and the values for S/O/D are used for the Risk Priority Number (RPN) calculation later in the FMEA worksheet. For example, the range can be reduced to arbitrary subsets like e.g. [1,3,7,10] for Occurrence.
b) The labels can be freely defined, but they must be unique. The labels will be what is visible in the FMEA worksheet (drop down lists) as well as in the risk matrices. For example, the severity values could be set to [I, II, III, IV] for the UI while internally they are numbered [2,4,6,8].
c) The description column can be used to define the precise meaning of each value. The value will be shown as tooltip in the FMEA editor.
For convenience, the settings page provide presets for the major FMEA standards from VDA-AIAG, SAEJ1739, and MIL-STD-1629A. Note that clicking one of the presets will set all values as described in those publications.
The FMEA risk assessment is supported by evaluating risk parameters pairwise by means of Risk Matrices. Each combination of risk parameter values receives an associated risk class in the matrix, i.e. either LOW (green), MEDIUM (yellow), or HIGH (red). For example, entries with Severity=10, Occurrence=8 could be rated HIGH.
In order to configure the risk matrices do the following:
Go to the Project Settings via context menu of a project (or top menu Project)
Open the FMEA | Risk Matrices for Risk Priority Numbers page
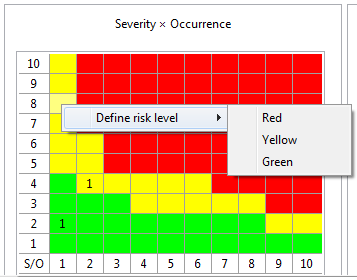
Risk matrices are provided for all combinations of risk classification parameters, i.e. Severity x Occurrence, Severity x Detection, Occurrence x Detection, and correspondingly for Severity x Frequency, Severity x Monitoring, Frequency x Monitoring.
Each matrix has a maximum of 10x10 cells and is showing on its axis the labels of a risk parameter. If you do not see some of the matrices, then there have not been values configured for certain risk parameters (see Setup of FMEA Risk Classification).
Select a single cell in a matrix or select multiple cells by holding the Ctrl-Key down, then open the context menu and select Define risk level → Red | Yellow | Green. Afterwards the marked cells will change to the selected risk class.
Apply and Close the preferences to make the changes effective.
After the risk matrices have been set up, each worksheet that you create in the project will inherit the risk matrix definitions. If required, these matrices can be reconfigured in the FMEA worksheet (see Using Risk Matrices).
The FMEA worksheet provides a view on a system model and reflects its structure. The content of the FMEA model is kept in sync with the associated design model contents, that means entries always match an underlying model element and cannot exist without one. This is called an attached FMEA and the step to create such a worksheet is called derivation in medini analyze.
It is also possible to define "standalone" FMEA worksheets without such a relationship and with decoupled content (no underlying model). These FMEA sheets are called detached FMEAs and should be the exception. They might be used for importing legacy data from Excel. Note that all failure net capabilities are not available for detached worksheets.
In order to execute an FMEA for design model you can:
Derive an FMEA Worksheet from a SysML model or element by using the entry "Derive | FMEA Worksheet" from the context menu in the Model Browser, or
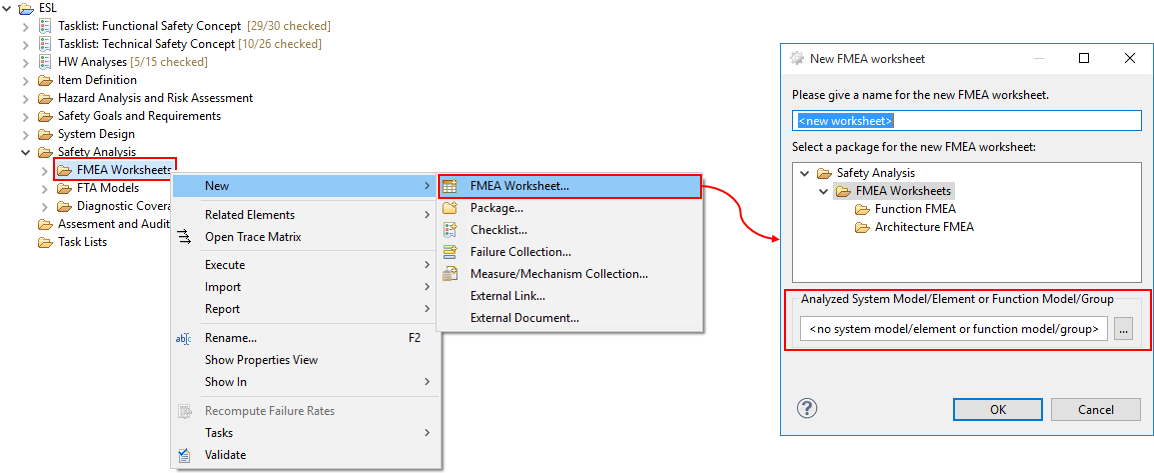
Create the FMEA via the "New | FMEA Worksheet..." on a package in which FMEA worksheets may be stored. In thise case select the corresponding SysML model in the creation dialog.
The second option is shown in the following picture. Note that if no model/elemnet is selected, a detached FMEA is created which can only be used for legacy import and other special use cases (see Creation of detached FMEAs) .
As result, the created FMEA worksheet is initialized with entries for all elements of the corresponding model: functions, activities, actions, components, etc. are listed together with already assigned failure modes/malfunctions, failure rates as well as any cause/effect relationships between failures that are present in the model. If a failure cause has already an associated detection or prevention measures, these will also be added to the initial worksheet in the current design control columns (prevention or detection).
If the failure effects have a severity defined (or inherit a severity from higher level effects), the severity is shown in the worksheet. Similarly, if failure causes have an occurrence value, this value is also shown at the places where the failure appears as cause. Note that these two risk parameters can be selectively changed in either the model or the editor (see Executing the FMEA).
Detached FMEA worksheets are not synchronized with any model, but provide a standalone worksheet, e.g. for legacy data import. To create a detached FMEA, simply do the following:
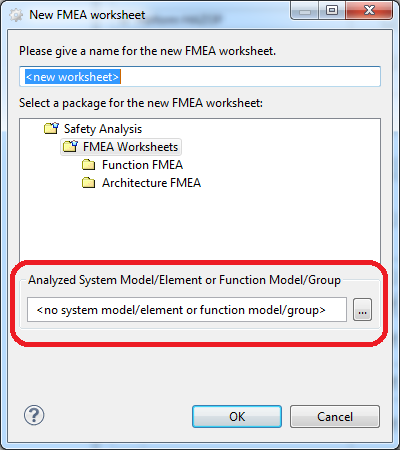
Select "New | FMEA Worksheet..." from the context menu of a package in the Model Browser where the creation of FMEA is possible
Leave the system design model reference emtpy
This may be useful to perform an FMEA for parts of the system that are not described by a System/Function Model in the medini analyze project (e.g. FMEA for software or for hardware on the electric level).
Ansys medini analyze supports various approaches to FMEA based on the common concept of the failure net. The tool allows to create and link FMEA related data in any order, e.g. starting with a model first and connecting the failure net before deriving the FMEA spreadsheet as typically done according to VDA-AIAG guideline, or deriving the worksheet and adding/connecting the information as required within the worksheet as in SAE or MIL-STD-1629.
Before conducting the actual FMEA, we recommend to setup and configure the worksheet as well as the list of available measures. See Creation of FMEA Worksheets for the initial worksheet setup and Measures and Design Controls.
During the FMEA analysis, the analyst has to determine the following information which is presented in columns of the worksheet and stored in the underlying model:
Potential failures of the element. If the model has already been analyzed, this information might already be (partially) available. If functions are analyzed, the potential failures are of type Malfunction, for structural elements such as parts and ports the type is Failure Mode.
Potential failure effects of a failure. This is a reference to other failures of the corresponding failure mode/malfunction and shows part of the failure net. Adding references to either the worksheet or failure net will be done on the model and change the worksheet.
Potential failure causes of the failure. This is a reference to failures causing the corresponding failure mode (not directly to the effect)! In the same way as for failure modes and effects, it shows part of the underlying failure net.
Current design controls to prevent, detect or mitigate the failure cause. Here, a selection of all measures defined in the project is available. That means the assignment of measures will be bound to the failure cause (not the potential failure). Therefore, measures will appear in all FMEAs that show the same failure as cause.
Note that a set of prevention and detection measure is grouped by a so called measure group. Each failure can have multiple measure groups that define e.g. incremental design improvements or alternative measures. Each measure can define its status and completion date individually which is then aggregated at the measure group. With the option "´Hide measure group information" on the Cover page this information can be shown also in the worksheet. Hint: to browse all measure groups associated to a failure, you can use the property view in addition to the FMEA worksheet.
Risk and criticality assessment. The FMEA sheet provides Risk Priority Numbers (RPN) for qualitative risk assessment and failure mode and component criticality numbers (FMECA) for a quantitaive assessment. The parameters come again from the underlying model, such as Severity/Occurrence/Detection or failure rates/beta-factors, see Risk Priority Numbers (RPN) and Failure mode and Component Criticality.
Actions derived for changes of design controls or the design. The option "Hide action columns" on the FMEA cover page determines whether columns for actions will be visible. Recommended actions and actions taken can be tracked textually with responsibilities and target dates. Multiple actions can be added using the buttons "Add recommended action" and "Add taken action" on the right side of the worksheet. Note that the set of actions is the only information that is purely contained in an FMEA worksheet.
In addition to the actions taken, you can re-assess the severity, occurrence and detection values in the extended table view. A revised RPN will be computed and compared to the original RPN.
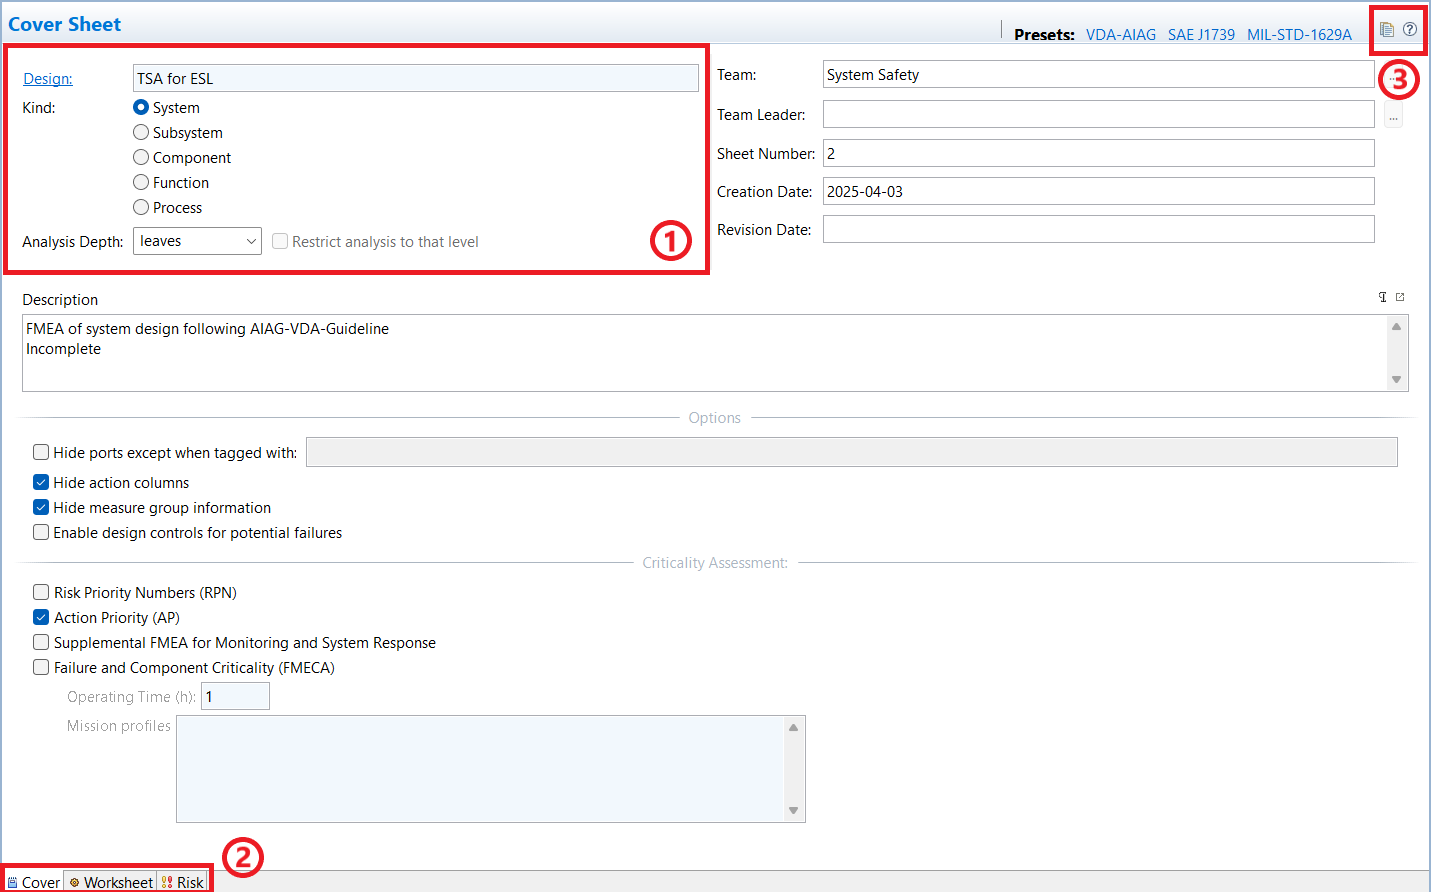
After creation of an FMEA worksheet for a SysML model, the FMEA worksheet must be configured to show the right set of data for the analysis. The editor features three pages:
The Cover page contains all settings and configuration options. For example, you can choose what part of the model shall be shown in the worksheet (e.g. structure, behavior), which columns and risk evaluations will be used, or what type of FMEA is conducted (e.g. FMECA, FMEA for Monitoring and System Response, etc.).
The Worksheet page provides the analysis editor itself and is based on the model content, potentially filtered according to the settings made on the cover page.
The Risk page provides a detailed risk and criticality evaluation of the analysis. It contains the risk matrices that can be used to assess and optimize the FME(C)A. Details on using the risk matrices for the analysis is provided in Using Risk Matrices.
The cover page also contains metadata about the FMEA contents, such as system design reference, author, creation date, and so on. See the screenshot below.
The options for the spreadsheet have the following impact of what is shown as content in the worksheet:
Kind: The kind of worksheet influences which elements of the underlying system model are analyzed in the spreadsheet. System/Subsystem shows all types of model elements and is the default. Selecting Component restricts the worksheet to structural model elements only (i.e. parts and ports), that means functions and behavioral concepts are ignored. Function/Process focuses the worksheet on functions and activities/actions, hiding structural elements (unless required as containment path to the functions). Note that choosing the worksheet kind is purely a view option on the analyzed design and has no impact on the model contents (no changes/deletions or similar).
Analysis Depth: If the design model from which the FMEA worksheet has been derived contains deeply nested elements, this option allows you to limit the elements to be considered in the worksheet. By default, all contained elements are shown recursively as they exist in the model (unlimited depth). Selecting a cut-off level of n restricts the worksheet to showing only elements up to the nesting level n and hides all content that exists at level n+1 and deeper.
If a certain nesting level is selected, the additional option "Restrict analysis to that level" is enabled and can be selected. When you enable this option, all elements above the selected level are shown only as spanned rows (no failure modes, design controls/actions, etc.).
Hide ports except when tagged with: Option to hide ports of elements from the worksheet. When selected, all ports are hidden. To include certain tagged ports in the worksheet instead of hiding them, enter the corresponding tag(s) in the accompanying text field. For more information about tagging, see Tagging Elements.
Note: This option is not available if the Function or Process kind is selected, because these hide ports automatically.
Hide action columns: Option to hide the Recommended Actions, Responsibility and Target Completion Date, Taken Actions as well the the Revised Severity/Occurrence/Detection columns from the worksheet. This option is for example useful if the VDA FMEA guide is followed and actions are tracked at measures and measure groups directly.
Hide measure group information: By default the worksheet does not show the header for measure groups. This option enables a spanned row for each group of measures that shows the name, status, and completion date as described by the VDA FMEA guide.
Enable design controls for potential failures: Selecting this option lets you add measures to potential failures without first creating a failure net. For more information, see Adding Measures without Causes.
Additional fields for team, team leader, sheet number, creation/revision date. These fields do not have any impact on the worksheet, but if you have defined a safety plan, milestones, and users, you can directly reference them from the team, team leader, and revision date fields. This provides a maximum consistency with your planning activities.
For the criticality assessment, three methods are supported:
Risk Priority Number (RPN): This option will turn on the RPN and enable corresponding columns (Revised) Severity/Occurrence/Detection for risk assessment in the worksheet. The RPN will be computed as the product of Severity x Occurrence x Detection. Note that the individual levels can be configured as described in Setup of FMEA Risk Classification
Action Priority (AP): Option to turn on the Action Priority risk assessment according to the VDA-AIAG FMEA guideline. The required columns (Revised) Severity/Occurrence/Detection will be enabled. For details on the Action Priorities (AP).
If in addition the FMEA-MSR option is selected, additional columns will appear such as Frequency, Monitoring, "System Response", and "Most Severe Effect after System Response" to enable an analysis for the failure handling at system operation. For more information about the failure net and mitigated effect modeling see also Working with the failure net.
Failure and Component Criticality (FMECA): If an FMECA according to MIL-STD-1629A or related component criticality assessment shall be conducted, this option should be used.
In order to quickly adjust the various options to the layout known from specific FMEA standards, the page provides some "Presets" (i.e. active links) for convenience. These do the basic settings of all options to align the worksheet with the respective standards (VDA, AIAG, SAE J1739, MIL-STD-1629A).
Beside the meta-data and configuration, the page features a tool bar that provides a duplicate button for creating a complete copy of the worksheet. For details, refer to Copy and Paste for FMEA worksheets.
The Worksheet page of an FMEA editor is the main part that contains the analysis itself. The rows and columns shown depend on the settings in the Cover page. You can customize it to perform the type of FMEA you want: For more information, see Setting up an FMEA Worksheet.
To hide/unhide any column of the FME(C)A table, right-click in a header cell and change the visibility of columns as for all other table editors (see General aspects for table editors). Note that you can insert extra columns into the table using profile properties. Such properties have to be defined for the FMEA entries, such as "Component entry" or "Failure mode entry". They appear next to the columns of the profiled element and inherit their cell-span.
The worksheet table shows all malfunctions or failure modes assigned to elements of the analyzed model. These malfunctions/failure modes automatically appear in the table as soon as they are defined at an underlying element. Adding/removing failures directly writes through to the model itself. The same holds for the cause/effect relations between failures that are also shown as effects or causes, respectively, their severity and occurrence values, and already defined measures for prevention and detection.
You can easily drag and drop failures to the failure mode, cause, and effect columns. Just drag any failure mode, malfunction, hazard, or error from the Model Browser or from other cells of the worksheet. Note that dropping a failure to the cause/effect column creates an appropriate relationship in the underlying model, whereas dropping a failure mode to the Potential Failure column creates a copy of the failure.
You can also click in a component entry cell and use the context menu entry
to add certain SysML elements. This is equivalent to the
 button described
below.
button described
below.
As an alternative to drag and drop or the context menu, use the following buttons in the button area next to the table to change the entries in the table. The buttons provide the following functions:
Table 7.1: FMEA Buttons
| Button | Name | Description |
|---|---|---|
| | New... |
Adds the SysML elements element, characteristic, port, or function to a derived worksheet. For typed parts, only element, characteristic, or function are available. The button is enabled when a component/function is selected. |
 | Add failure |
Adds an additional failure mode/malfunction sub-row to a component/function. This button is enabled when a component/function or a failure mode/malfunction is selected. |
 | Add measure group for design controls | Adds an additional measure group to the cause to reference design controls for prevention or detection. This button is enabled when a failure cause or a current design control is selected. |
 | Add recommended or taken actions | Adds any recommended or taken actions. Note that these actions are only stored in the worksheet for the corresponding measure groups, not in the underlying model. |
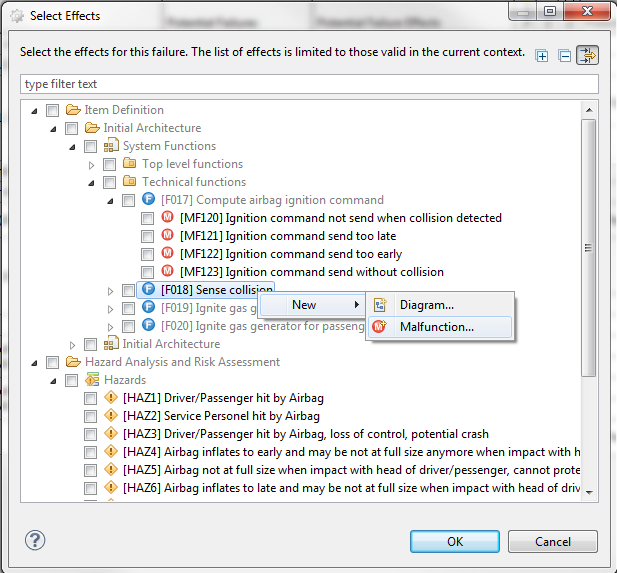
To select causes and effects in the FMEA worksheet, you can double-click the appropriate cell to open the Select... dialog. In the Select... dialog, all available failures of the project are listed and you can add or remove effects and causes. Note that empty collections are shown by default. You can edit these from within the dialog.
The first time you open the Select... dialog, it shows all SysML models and failure collections. When you make changes, the dialog remembers the state of expanded or collapsed states the next time you open the dialog.
If you know the name of the cause or effect you want to add, you can just start typing in the cause or effect cell, even in cells that already contain entries. When you type, a list of available matches appears. Available matches are those that are in scope and have not already been applied in that cell. You can keep typing or scroll through the matches. Select the one you want and press the key to add it to the cell. All characters except spaces and returns are supported. To dismiss the list of matches, press .
New failures can be created on the fly using the context menu in the selection dialog as shown below. Any changes are directly propagated to other parts of the worksheet where the elements/failures are shown.
Because the different cells in the FMEA worksheet depend on each other (for example, failure cause depends on failure mode), some cells are not directly editable depending on the progress of the FMEA. Such a cell is also indicated by a gray background color. This will change as soon as content is entered into the cell on which this cell depends or when new content is created using the Add buttons at the top of the table.
There are multiple ways to remove data from the FMEA table:
Select a cell and in the context menu, select Remove Element.
This removes the complete cell, its content as well as all dependent cells and their content. Note this is only available for all those elements which can be created by the buttons next to the table.
Select a cell and click the button next to the table.
This also removes the complete cell, its content as well as all dependent cells and their content. It is also only available for all those elements which can be created by the buttons next to the table.
Note that dependencies also influence the deletion of cells from the table: if an entry is removed, all of its dependents are also removed too. For example, if a failure cause is changed in respect to its measures (design controls), all entries for that cause are also updated.
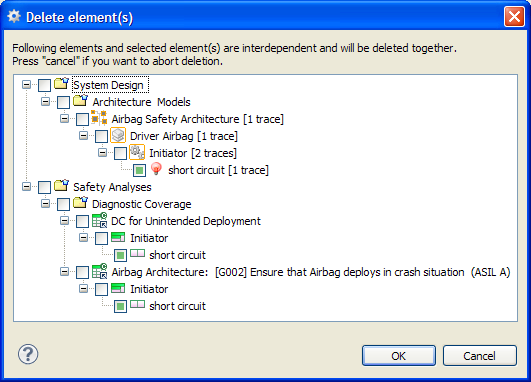
If a measure group is removed from an FMEA using the button, the corresponding element is removed from the analyzed model (i.e. the analyzed model and the worksheet are held in sync). When deleting any elements in the analyzed model or in the worksheet, the dependent elements are shown. You are asked to confirm deletion, including these elements from FMEA worksheets or analyzed model:
In addition the worksheet page supports the following additional options and functionality:
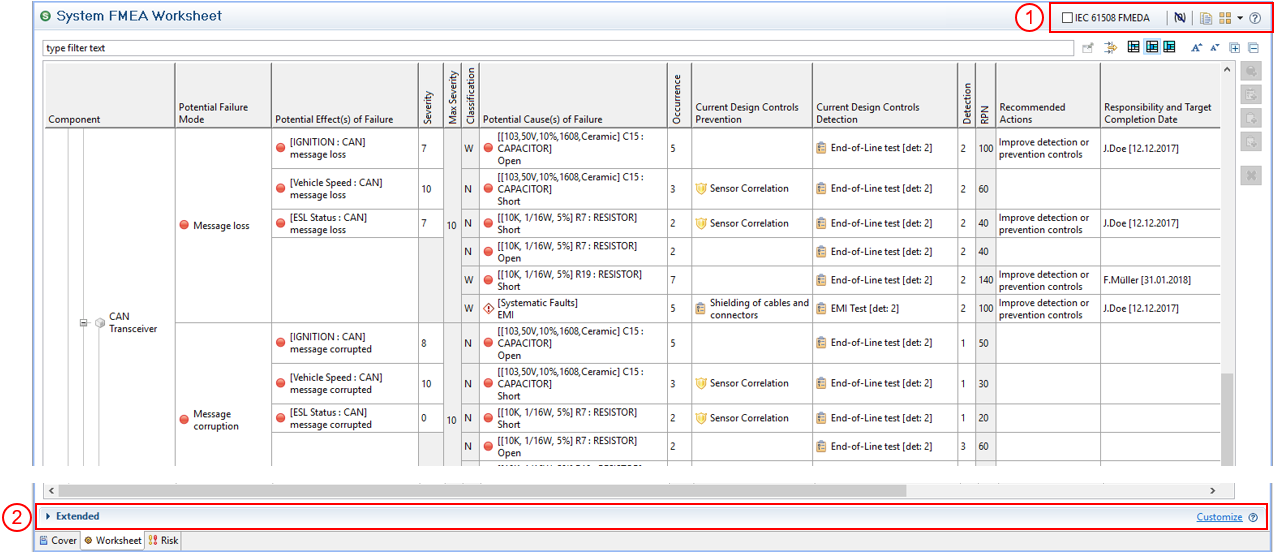
Tool bar & options, see (1) in screenshot below: An option exist to hide overridden severity and occurrence values (see Executing the FMEA). Additionally, two actions are provided to open the corresponding design model and to duplicate the whole worksheet. For more information about duplication, see Copy and Paste for FMEA worksheets.
In earlier releases, the check box FMEDA Columns was allowed to toggle between FMEA and FMEDA (according to IEC 61508). It is now deprecated and should not be used. For dedicated FMEDA support, see FMEDA and Diagnostic Coverage Metrics.
Extended area, see (2) in the screenshot below: If additional properties for FMEA worksheets have been defined, these properties appear here (see Profiling mechanism).
The hierarchy of content in the FMEA table is also shown in the Model Browser if you unfold the entries for each component there. Here you can also specify additional traces for the elements of the FMEA to other content in the project, such as from design controls or recommended actions to requirements.
In certain cases, you may want to assign measures (design controls) to potential failures or weaknesses without first creating a failure net or doing a cause/effect analysis. For example, you may want to see the next higher level design controls quickly in the worksheet without opening the failure net.
Instead of creating a cause for a basic failure mode, you can describe the measures for the failure modes themselves in the worksheet. You can do this by creating a placeholder cause in the worksheet and then assigning measures to it.
To create a placeholder cause, complete these steps.
In your medini analyze project, in the cover sheet for the FMEA worksheet where you want to add the placeholder cause, select the checkbox Enable design controls for potential failures.
Click the Worksheet tab.
In the Potential Failure Causes column, the failure of each respective component is displayed as a placeholder cause. You see the name of the corresponding failure in parentheses in a grayed-out cell with no icon.
You can now click in the corresponding Current Design Controls Prevention and Current Design Controls Detection cells and assign measure groups to the placeholder cause by right-clicking in the Potential Failure Cause cell, or by clicking the Add measure group for design controls or Add measure group for kind diagnostic monitoring buttons to the right of the worksheet.
To see additional measure group information, in the cover sheet, unselect the Hide measure group information check box.
To filter for only placeholder causes in the Potential Failure Causes column, click the column filtering button to the right above the table, and in the new row enter "(", for example.
After you have assigned a measure to a placeholder cause, you can select the failure as a cause for other potential failure modes. The cause includes the same measures as in the selected failure.
Note that unselecting the Enable design controls for potential failures checkbox removes the related worksheet entries and any custom data you may have attached to them.
You can easily create a trace-like link from a component entry in a derived FMEA worksheet to an element in a shared project. The component entry can be in a worksheet in the same project as the element, or in any other shared, local, or offline project. You can link to the same element from multiple worksheets.
After you have created the link, hover over the link to see project information about the shared element. Single-click the link to see the element highlighted in the Model Browser. Double-click the link to open the corresponding FMEA worksheet or editor.
You can link to elements contained in named versions of shared projects. Hovering over the link shows the project version. To be able to navigate the link, that version of the project must be loaded.
If the element is renamed in the Model Browser, the name is updated in the Cross Project Link column in every worksheet that links to the element. If the element is deleted in the Model Browser, double-clicking the link in the FMEA worksheet opens an informational dialog box with next steps.
Note:
Elements must be from shared (collaboration) projects. For more information about collaboration projects, see Real-Time Collaboration.
You can set only one link per component
To link to an element from a worksheet, complete these steps.
In medini analyze, load the shared project containing the element. Also load or open the project where you want to create the link.
In the worksheet where you want to add the link, right-click in the header row and from the column list select Cross Project Link.
The Cross Project Link column is added as the last column.
In the Model Browser, select the element and drag and drop it to a cell in the Cross Project Link column you added in the previous step.
To overwrite the element link, simply drag another element to the same cell.
To clear the cell, right-click in the cell and select Clear.
Note that if the linked element is deleted from the shared project, the link remains in the cell until you explicitly clear it with the Clear command.
In order to analyze the safety aspects of a system or subsystem, it is important to understand the cause-effect chains of the failures that can occur in the system. The primary view to visualize such cause-effect chains is the failure net editor. In this graphical editor, it is possible to visualize, navigate, and model the failure propagations across all design models of a project.
The graphical failure net editor can be opened for a certain failure directly from the context menu of a failure mode, a malfunction, a hazard or an error in the model browser or FME(D)A worksheet:
Right-click to open the context menu of a failure, such as in Model Browser, hazard analysis, FME(D)A table, and so on
Select Show Failure Net to open the editor
The failure for which the failure net diagram view is created is called "failure in focus". Multiple failure net editors can be opened in parallel in medini analyze, each of them then has exactly one "failure in focus".
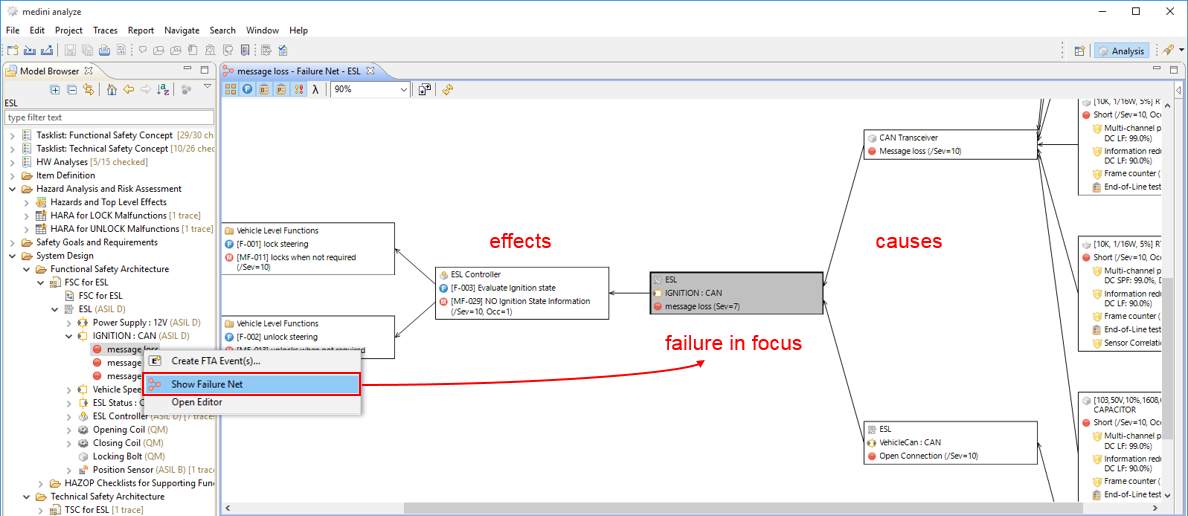
The failure net is automatically computed, laid out, and updated. It contains all effects and causes of the failure in focus recursively, causes are placed to the right, effects to the left of the failure in focus.
As seen in the figure, the failure in focus is colored in gray whereas all the effects and causes are colored in white.
The view is automatically updated whenever a cause or effect which is related to the failure in focus is added/removed in the underlying system design model.
By double-clicking on another failure on the diagram, this failure can be torn into focus and hence the whole failure net will be re-evaluated for the new failure in focus. This can also be triggered via the context menu entry Focus on failure.
Note that the failure net editor supports several options for the contents to be shown for each failure:
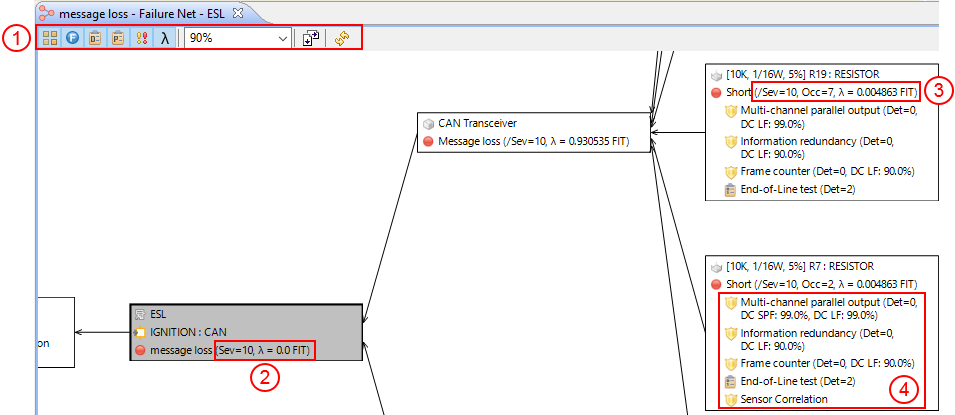
The editor's button bar (1) allows to shows/hide the following information (options from left to right):
The structural element that contains the failure. This is either the direct container for failure modes (i.e. component/part), the component and the port if the failure mode is contained in a port, or for malfunctions the corresponding structural element that contains the function of the malfunction. For failures in collections the name of the collection is shown.
If malfunctions are shown, their functions can be optionally shown/hidden as required via the next option.
All detection measures associated to failures can be shown/hidden. This includes those design controls and safety mechanisms linked in the FMEA and FMEDA/Diagnostic Coverage worksheets in the corresponding columns.
All prevention measures associated to failures can be shown/hidden. These are the same as defined in the FMEA column for design controls prevention.
The associated risk parameters Severity and Occurrence that are associated with the failure can be shown as an extended label (if defined), see (2) and (3) in the screenshot above. The Severity is either shown e.g. as "Sev=10" if it is defined directly at the failure (see 2) or prefixed with a slash "/" if inherited ("derived") from the failure's effects (see 3).
The inherited Severity is always the maximum of all effects (recursively). If you want to find out where the value is exactly coming from, you can open the "Property View -> Risk" tab and use the "Open source of value" link on top of the page to navigate to the failure that defines the inherited severity.
The failure rate can be added to the label with the next option (lambda symbol). Note that this will only work for failure modes that have such quantification (see Safety Analysis Overview) and for malfunctions, which have a derived failure rate based on their causes.
If options are changed it is recommended to refresh the failure net view using the refresh button ("double arrows") or pressing F5. This will re-arrange the failures and optimize the spaces required for the net.
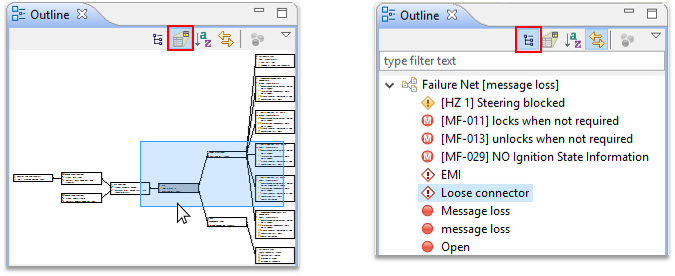
Note that the editor also supports the general outline view to navigate through larger failure nets (available under "Window | Show View... -> Outline View"):
To navigate large failure nets more easily in medini analyze, use the toolbar in the failure net editor to limit the level of elements you want displayed around a selected element. You can easily increase or decrease the level, set a preferred maximum distance level, or quickly return to previous views using the back button or history drop-down.
When you have limited the display of connected elements to a specific level in the
failure net, elements that have additional levels of elements to display are marked with
a  symbol. Double-click the symbol to expand the next level of
elements.
symbol. Double-click the symbol to expand the next level of
elements.
The cause/effect editor remembers the state of the maximum distance as well as the expand and collapse states when you close and re-open the cause/effect net, or change the failure in focus.
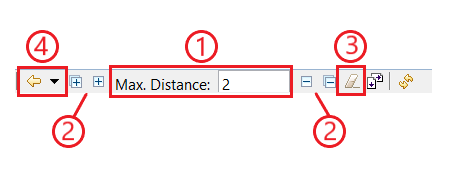
Table 7.2: Failure Net Toolbar Actions
| To... | Do This |
|---|---|
| ...limit the maximum distance between elements in the editor |
Enter a number in the Max. Distance field (1) so that only the specified level of elements around the selected node are expanded. |
| ...set a default maximum distance between elements |
To set a default maximum distance between elements, complete these steps.
Default setting is |
| ...increase or decrease the maximum distance between elements | Click the single "+" or "-" (2) to increase or decrease one level at time.
Click the multiple "+" (2) to maximize the distance to unlimited. Click the
multiple "-" (2) to collapse all levels around the selected element. Note that you cannot use these buttons to increase/decrease the maximum distanceif the maximum distance is set to unlimited. |
| ...reset the distance between elements |
Click the |
| ...expand or collapse connected nodes |
Double-click the left or right edge of an element to expand or collapse additional connected nodes. |
| ...set the view back to a previous one | Click the |

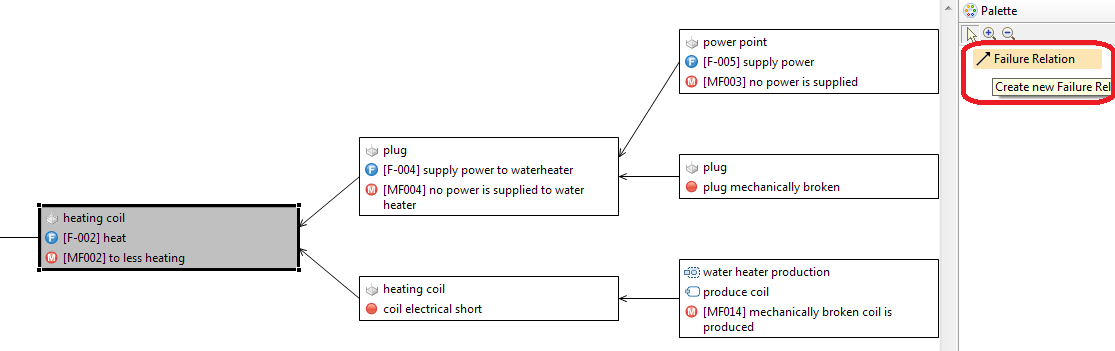
The failure net editor supports editing of the cause-effect relations, e.g. adding failures as causes, effects or removing relationships as well as complete failures. The following possibilities exist to modify the failure net with the help of the graphical editor:
Adding or removing relations between failures on the diagram
The editor palette offers a possibility to select and draw a connection between two elements on the diagram. If such a relation is drawn, a new cause-effect-relation in the model is established.
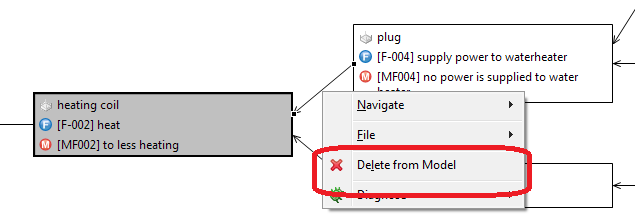
The editor also allows to delete a cause effect relation from the diagram by selecting it and using the context menu action "Delete from model".
Adding relations by drag and drop
A new cause or effect relation can be established by dragging failure elements from the model browser to the diagram. The drop is only possible when the mouse is moved over an existing element on the diagram. If the element form the model browser is dropped on the left part of an existing element, the dropped element will be a new effect of the existing element. If dropped on the right side, the dropped element will be a new cause for the existing element.
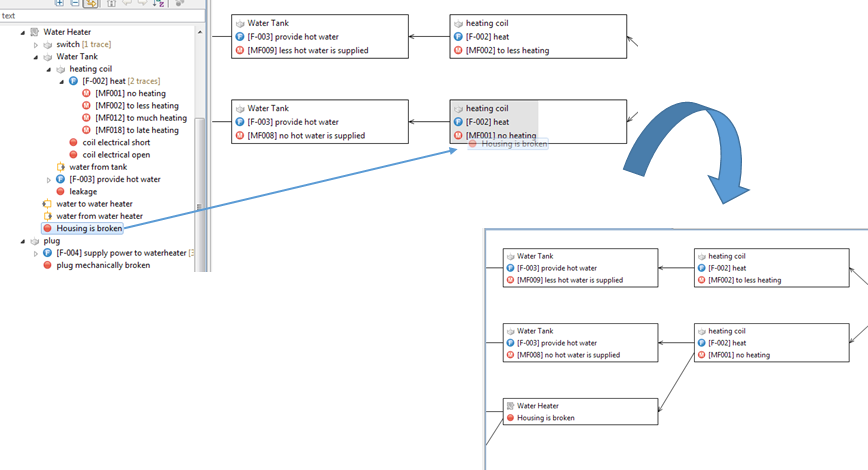
After the editing operation the failure net is automatically refreshed and shows potentially all new failure causes, or effects (recursively) of the dropped failure. The editing operations will ensure the following constraints:
in case of creating loops in the cause effect chains, you will get a warning
hazards as top level elements in the cause effect chains cannot be set as causes
there is only one relation between two elements possible
Removing of elements (failures)
An element can be removed by using the context menu entry Remove from Model of the element on the diagram. This action completely removes the element from the model.
Modeling mitigated effect relations (hybrid failure net)
By default, a cause-effect relation models a failure propagation in absense of safety mechanisms or the remaining portion due to insufficient diagnostic coverage. Those effects constitute the normal failure net and will be seen e.g. in the effect column of an FMEA. If a relation shall express a mitigated effect as result of implemented diagnostics/safety mechanisms, an additional annotation is required:
Select the relation in the graphcial failure net editor
Open the Property View for the relation
On the base tab, you will be able to select the measure group with diagnostic(s) attached to the cause that will provoke the targeted failure as mitigated effect (in case the diagnostic is working fine)
In case you have not yet specified any diagnostics/measure groups, select the cause and enter them in the property view on the tab Measure Groups
Note that this reference to diagnostics at the relation itself will effectively create what is called a hybrid failure net according to VDA-AIAG FMEA guide. As consequence, the mitigated effect relations will no longer show up as normal effects in an FMEA worksheet, but in the "System Response" column of an FMEA-MSR (see Setting up an FMEA Worksheet).
In large and complex models, the complete failure net for a failure in focus can be too complex for an effective analysis in the failure net view. In order to reduce the complexity, the view allows to hide certain branches in the cause-effect-chain.
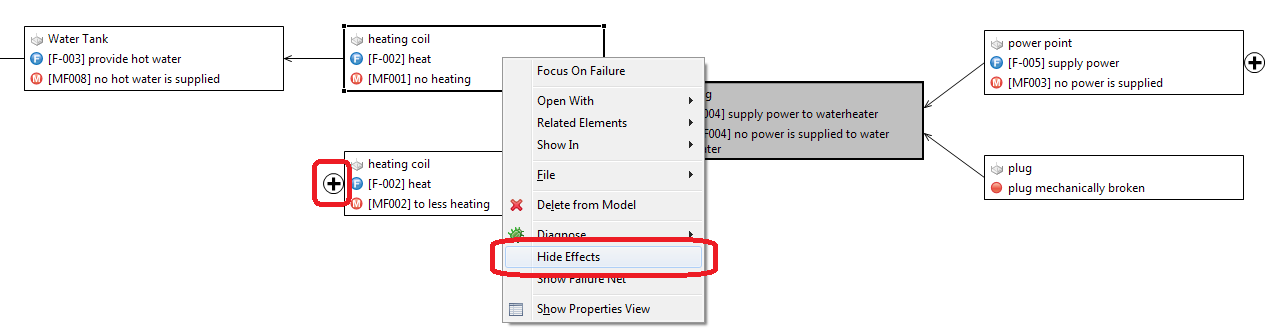
The hiding can be invoked on failures in the editor that have incoming causes (if the failure itself is in the chain of causes for the failure in focus) or outgoing effects (if the failure itself is in the chain of effects for the the failure in focus). Only for the failure in focus both effects and causes can be hidden.
The hiding is invoked via the context menu either by Hide Causes or Hide Effects. After the hide action is executed, the fact that there are hidden elements in the cause-effect-chain is denoted by a + sign on the element on the diagram.
Showing them again is available for those failure with a + sign via the context menu action Show Causes or Show Effects.
The qualitative risk assessment in FMEA is supported by Risk Priority Numbers (RPN). The corresponding option can be selected on the cover page of the FMEA worksheet. This section explains the handling of the parameters for Severity, Occurrence, and Detection, since these are taken by default from the underlying model, but can be overridden in the worksheet:
Severity is stored at the failure and is a value in the range of [1..10]. If a failure does not define a severity by itself, the maximum severity of the next level effect is taken as value, recursively until a defined severity is found. This means that failures will inherit by default the severity of rated top-level effects (e.g. hazards), unless these values are overridden by intermediate failures along the failure net.
Occurrence is a value in the range [1..10]. Occurrence values are stored at a failure and used once the failure occurs as a cause. More precisely, the occurrence value is taken into a measure group of the same failure as default value. Since the occurrence is influenced by prevention controls and hence, the set of prevention measures in a measure group determine the occurrence value and hence it can be changed per measure group, leaving the original value untouched.
Detection is a value in the range of [1..10]. Detection can be set for a group of measures separately and gets initialized with the detection value of a design control (i.e. measure) when it is added to the group.
The semantics of values 1 to 10 of Sev/Occ/Det is not defined by the tool, but can be configured as well as the possible values/ranges (see Setup of FMEA Risk Classification). In addition, "0" (zero) is defined for each parameter to indicate a non-analyzed entry.
By default, all editing in the FMEA worksheet will change the underlying model information. Note that the severity information is inherited recursively via the failure net from the final effects to any intermediate effects in the cause-effect chain (maximum from all effects). Therefore, a value might be shown even if the listed failure effect does not by itself define the value.
In general, a change to the Sev/Occ/Det values in the model will lead to a potential change at multiple places in an FMEA worksheet. That means a severity change will update all places where the failure is listed as effect and for measure groups, the occurrence and detection values will be changed for all places where the failure is referenced as cause.
If required, values can be selectively overridden in the worksheet, that means at individual entries of the worksheet where the information is shown. This is generally achieved by choosing "Override Value" from the context menu as shown below (here the example is the severity):
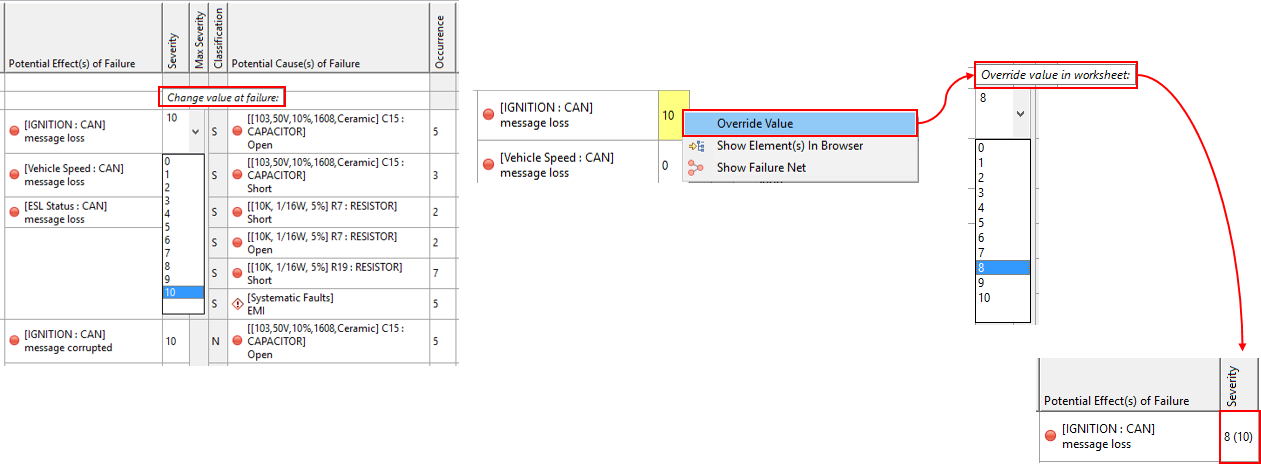
Note that the drop-down editor provides a hint where the value is actually changed (at the failure or in the worksheet). Once "Override Value" is selected, the editing mode is switched so that changing the value is purely local to the worksheet. As indication the value of the underlying failure is shown in parentheses. For example, if the failure defines "10" as severity and the effect is rather rated as "8", the cell will show a "8 (10)". In this case the "8" will be taken into account for the RPN of the worksheet.
To clear any overridden value from the worksheet and go back to the failure's value, the context menu supports a "Restore Overridden Value" action.
Note that it is possible to hide any original Sev/Occ/Det values (i.e. get rid of the parentheses and just show the considered values) using an option at the FMEA editors tool bar.
Based on the RPN parameters the worksheet will automatically computes the values for:
Risk Class of a failure cause with the following values:
S - Safety Legal in case the maximum severity for the related failure mode is larger than 8
W - Warranty in case the maximum severity for the related failure mode is a value from 5 to 8 and the occurrence for the failure cause is larger than 4
N - None in all other cases
Maximum severity for a failure mode as the maximum severity value of all its failure effects. This is simply the maximum of all severity effect entries (per failure mode).
Risk Priority Number (RPN) for each group of measures based on the maximum severity and the occurrence/detection values.
When working with risk matrices, the individual ratings of Sev x Occ, Sev x Det, and Det x Occ can be used drive the design optimization. See Using Risk Matrices to understand how to work with a risk matrix.
The Action Priority (AP) method for risk reduction from VDA-AIAG is supported as an alternative or addition to RPN. The FMEA worksheet supports the Design FMEA, Process FMEA, and FMEA for Monitoring and System Reponse (FMEA-MSR).
To activate the AP method, simply use the option "Action Priority" on the Cover page of an FMEA worksheet.
The AP option will enable a new column that computes the Action Priority ratings LOW, MEDIUM, or HIGH for each measure group attached to a failure cause in the FMEA worksheet. The measure group kind attribute determines whether the group is interpreted as prevention or detection measures during design and production or refers to diagnostic monitoring functions that will be built into the system. Each measure group can be either of kind "DFMEA" or "FMEA-MSR". Note the following:
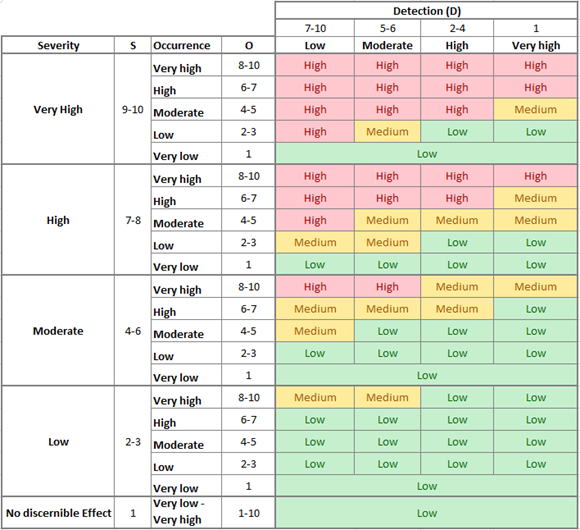
For DFMEA, the Severity, Occurrence, and Detection values will be shown and used to compute the AP rating. The AP rating is derived as defined in the VAD-AIAG guide, the table below summarizes the risk graph for convenience:
For each FMEA-MSR entry, the Severity, Frequency, and Monitoring values will be shown and used to compute the AP rating. For convenience, the corresponding AP table is summarized below:
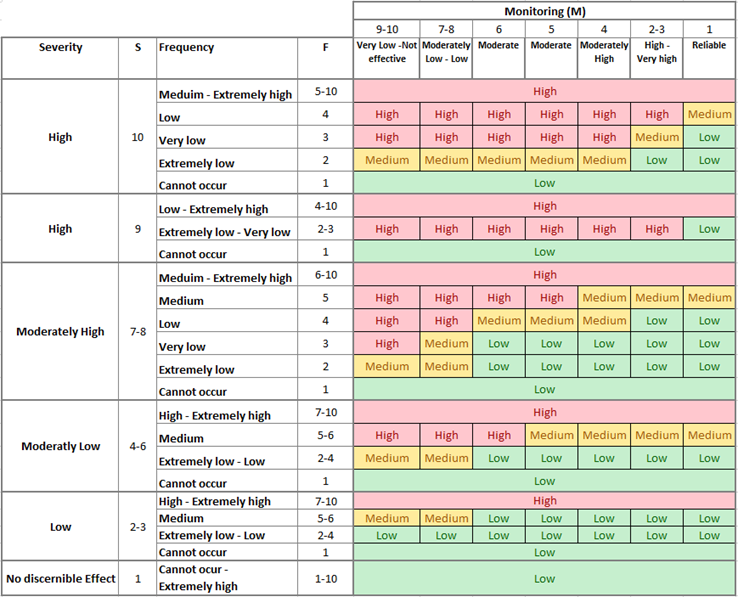
Note that if the Monitoring value is M=1, the severity value of the mitigated effect is used to compute the AP. The mitigated effect is the failure shown in the System Response column.
A quantitative FMECA is supported by Failure Mode Criticality and Component Criticality numbers. The FMEA worksheet provides an option to toggle the corresponding columns for risk assessment. In order to perform an FMECA you can configure it as follows:
Go to the Cover page of an FMEA worksheet and toggle the Failure and Component Criticality (FMECA) option
The Operating Time field becomes active right below to set the mission time used as default in the criticality number computation
The field below lists automatically all mission profiles attached to the SysML model from which this worksheet has been derived. Mission profiles are optional for the FMECA, but it might be useful to reference mission phases in which components are active. If your mission profile is not listed, you can go to the SysML model and attach the right one (see Assignment of a Mission Profile).
Since the FMECA will use failure rates from SysML components, you might want to filter to relevant portions of the model by setting the "Kind" option to Component to exclude functions and show or hide relevant ports.
After setting and configuring the FMECA options, you can switch to the Worksheet page to conduct the criticality assessment. The following columns will show up in the FMECA worksheet:
Failure rate of the component. This value comes from the SysML element that corresponds to the FMECA entry. The unit depends on the project settings, i.e. either FIT, FPMH, or FPH.
Operating Time (in hours) of the component. The default value that is shown comes from the Cover page of the worksheet. Each component can override the value as appropriate for its mission usage. Just enter a more specific value of clear the field to get back the worksheet default.
Failure Rate Distribution (α) and Failure Fate Fraction provide the failure rate assignment to each failure mode
Conditional probability (β) for each effect. The value comes from the underlying failure relation between the failure mode and the corresponding effect.
Failure Mode Criticality numbers: For each effect failure mode criticality Cm is computed as follows:
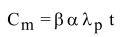
where t is the operating time. The number will be converted to the same unit that is used to present the failure rate, i.e. FIT, FPMH, or FPH.
Component Criticality numbers: For each component a set of criticality numbers is computed as sum of the failure mode criticalities with the effect having same severity level:
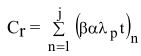
where t is the operating time, r is severity, and n ranges over all failure modes with the same effect severity r. For example, a criticality number of "C_3: 0.243" means that the criticality of the component for severity 3 is 0.243.
In case you need to perform a qualitative FMECA, i.e. a criticality computed as Severity x Occurrence, you can toggle the Risk Priority Numbers (RPN) options on the Cover page and set all Detection values to 1 or add a custom profile property as required.
The FMEA has an own page Risk used to display the risk matrices including the summary of entries in each risk class. Each matrix has at most 10x10 cells and is showing on its axis the labels of one of the fields Severity, Occurrence, Detection, Frequency, or Monitoring. Depending on the matrix axes, each cell shows the amount of FMEA entries that correspond to the x and y values e.g. an FMEA entry with Severity=4 and Occurrence=2 would be counted in the first matrix at cell [4,2] (index seen from the bottom left corner).
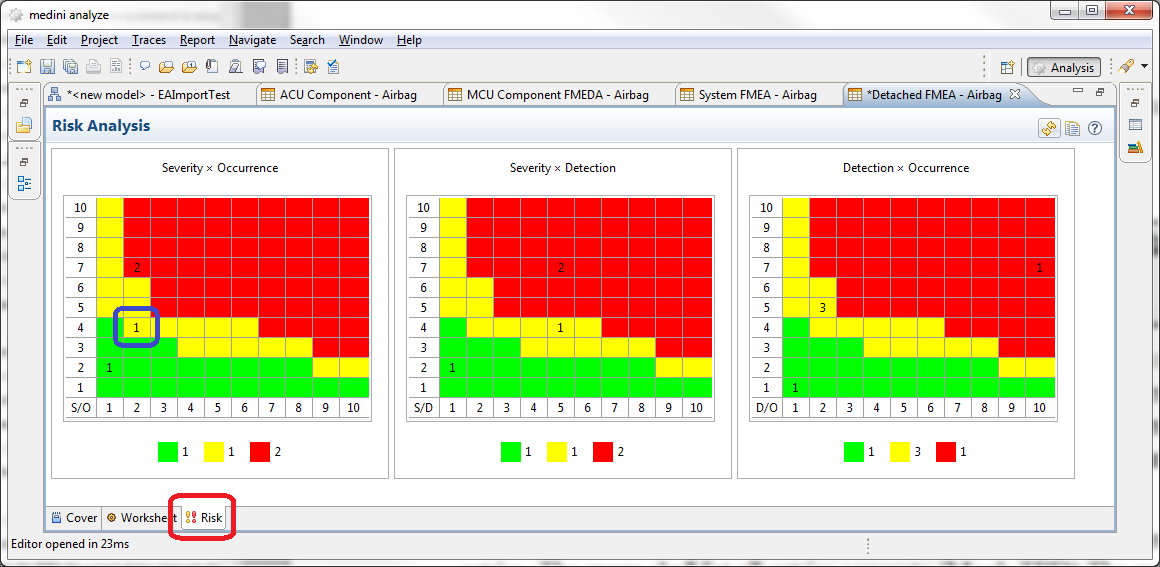
Each cell in the matrix has a color, indicating whether the risk level associated with the cell is considered HIGH, MEDIUM, or LOW. The default risk levels for each cell are inherited from the project settings and can be changed via the project settings (see FMEA Risk Matrix Definition). The risk level associated with a cell in the matrix can be adjusted. For doing this, use the context menu of a cell in the matrix and choose "Define risk level".
Below each matrix, a legend shows the total number of FMEA entries in each risk level.
A double click in a cell in the risk matrix of an FMEA model will select the corresponding elements in the model browser.
The matrices do refresh on a page change (i.e. when switching to the FMEA worksheet and back). The refresh can also be triggered via the refresh button in the top right corner of the risk matrix view.
The normal FMEA table supports an option "IEC 61508 FMEDA", which is considered deprecated (since version 2019 R3). This option does not support a detailed diagnostic coverage analysis and will be completely removed in a future version of the tool. The feature to perform the FMEDA is described in FMEDA and Diagnostic Coverage Metrics.
In case you need to use the failure rate for a customized worksheet, however, you can use this option to toggle the failure rate and failure mode distribution columns for the worksheet.
medini analyze supports to import existing FMEA data from Excel sheets into an FMEA model. In order to trigger the import, a detached FMEA worksheet has to be selected in the model browser. If no such model is available, it has to be created first.
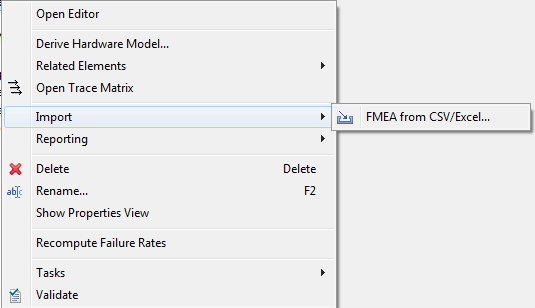
The import action is provided in the context menu of the FMEA model. Select Import > FMEA from CSV/Excel.
Selection of import data
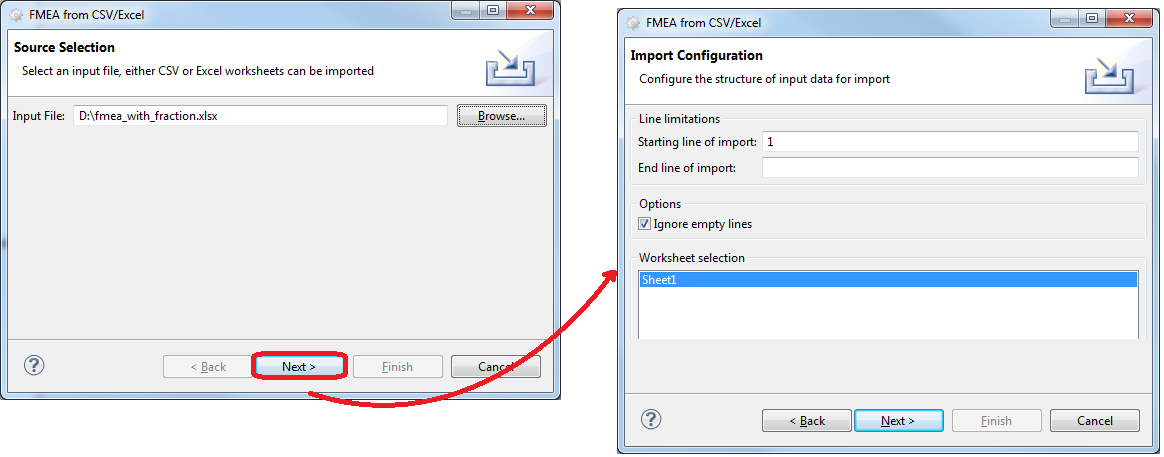
The import is controlled via the import Wizard. On the first page of the wizard, you have to select the file to be imported ("Input file"). Furthermore, the range of lines to be imported can be chosen via the fields "Starting line of import" and " End line of import". The Default start line is line 1. The line numbering starts with 1. The imported lines include the starting line and the end line.
In case the Excel worksheet contains multiple tables (worksheets) it is possible to select the ones that should be imported. The selection is done by clicking on the worksheet name. Multiple selection is possible by holding the Ctrl. key while clicking. De-selection is possible by clicking on an already selected sheet again. The line range (if specified) is applied to all worksheets.
Usage of cell spanning
As the FMEA table in medini analyze allows for a structured table with cell spanning, the Excel file to be imported can also make use of such structures. With this cell spanning, the following structures can be expressed:
multiple failure modes belonging to one component or function
multiple failure effects belonging to one failure mode
multiple failure causes belonging to one failure mode
multiple preventive or detection actions belonging to one failure cause
multiple recommended actions belonging to one failure cause
multiple actions taken belonging to one recommended action
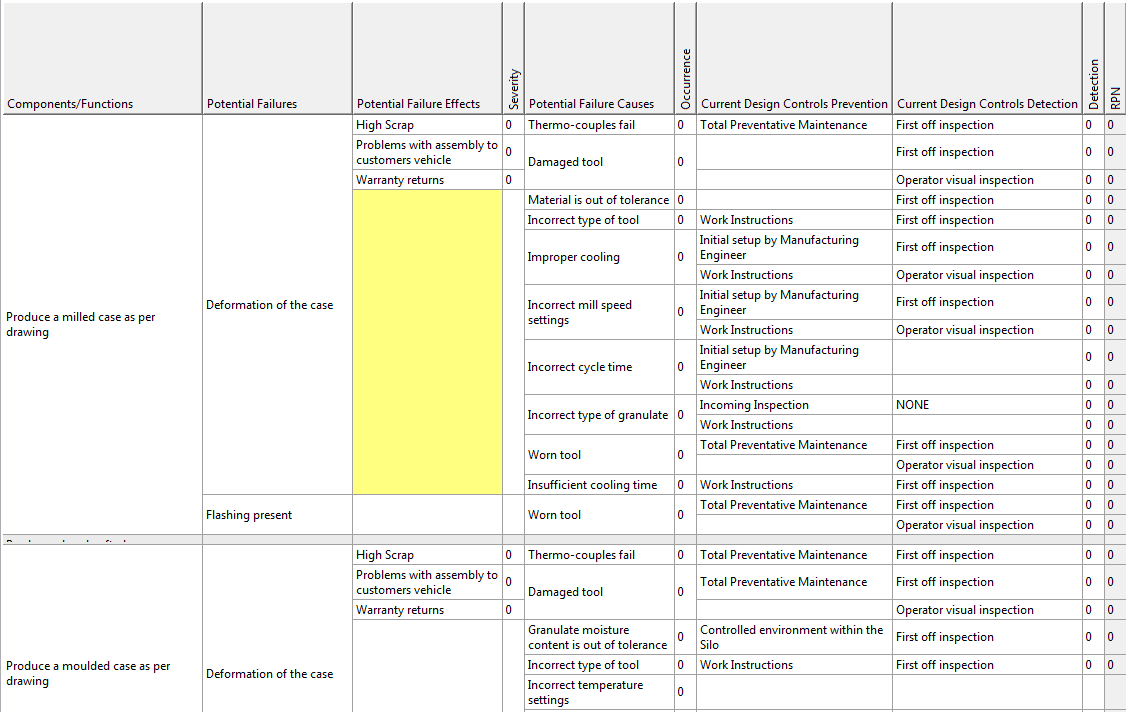
In the following figure, an Excel template with appropriate cell spanning is to be seen. Please note even if the cell spanning in the Excel gives the impression, that failure causes are belonging to failure effects, this is not the case. Both failure causes and failure effects are treated as lists belonging to the failure mode. If it should be expressed, that a causes is only leading to a portion of the effects, this should be expressed by splitting the failure mode itself.
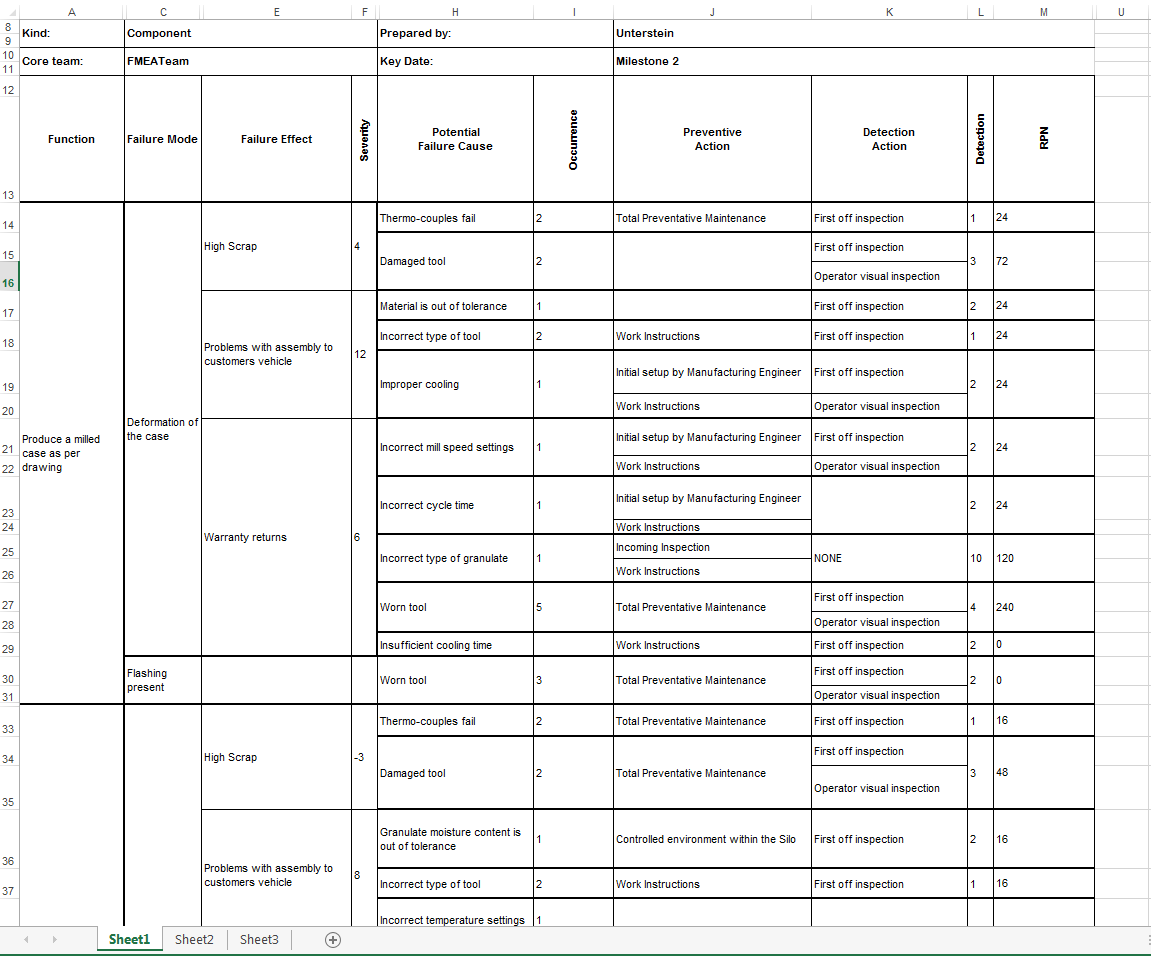
If the above Excel sheet with the cell spanning is imported into medini analyze, the resulting table looks as shown below. Note due to the treatment of causes and effects as having no relation to each other but are purely bound to the failure mode, the visualization in medini analyze is slightly different (but correct).
Column mapping
On the next page of the wizard dialog, you must specify the mapping of the Excel columns to the columns in the medini analyze FMEA worksheet. As to be seen in the figure, the data available in Excel is shown and at the top line (the table header) you can select for each column the corresponding column in the FMEA worksheet. The selection is done via clicking on the header cell. When clicked, a pop up is presented which allows to select a target column. Only columns which are not already the target of another mapping are displayed. If the column should not be imported, the entry "<skip>" has to be selected.
Besides the standard FMEA worksheet columns also profile properties can be targets for such mappings. If the Excel sheet to be imported contains columns that cannot mapped to standard properties of the FMEA worksheet, appropriate profile properties have to be created before starting the import in order to map them (see Profiling mechanism for details).
Columns that contain data which is computed out of other data need not be imported. They are also not offered in the mapping pop-up as targets for column import.
Please note using the button "Default Mapping" you can also apply a default mapping of all columns according to the order of columns in medini analyze. "Clear Mapping" on the other side will remove all mappings and set each column to <skip> again.
Since in the Excel sheet it may be the case, that the same components or function appears in different lines medini analyze provides the option "merge components with the same name". If enabled, these components are mapped onto a single object in the FMEA sheet of medini analyze.
Failure rate import
medini analyze offers two options to import failure rate data for individual failure modes of a component:
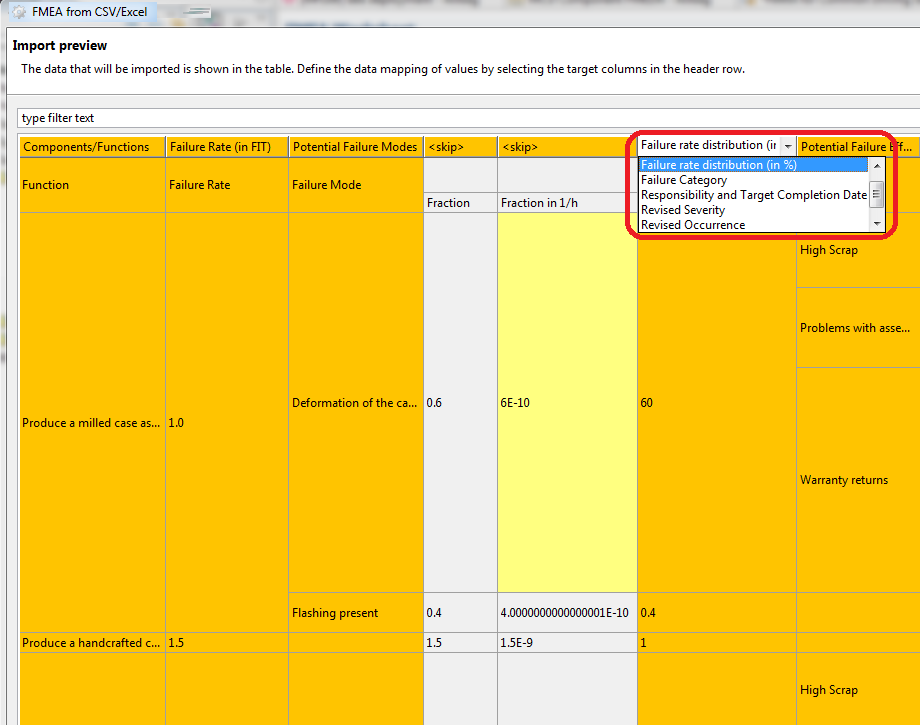
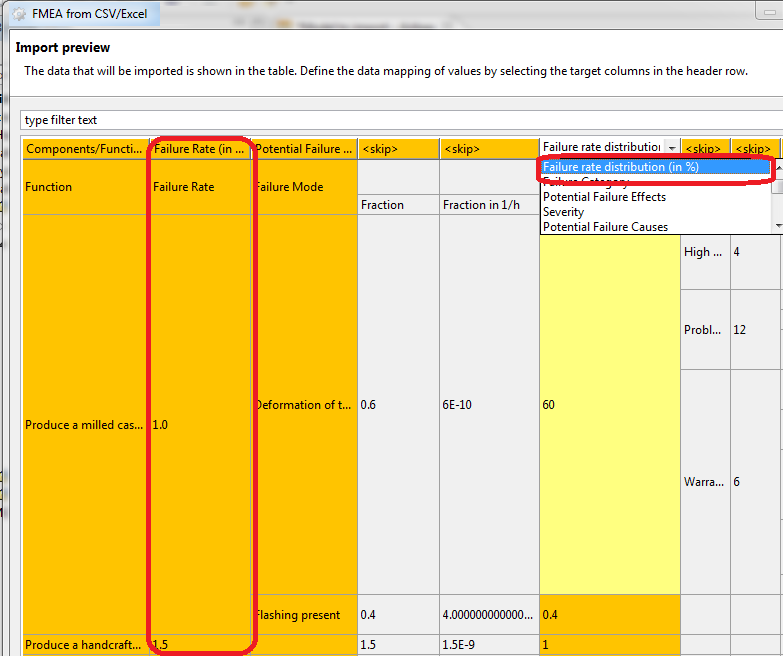
by specifying the overall failure rate of the component and the distribution of the overall failure rate of the component on the individual failure modes given as percentage number.
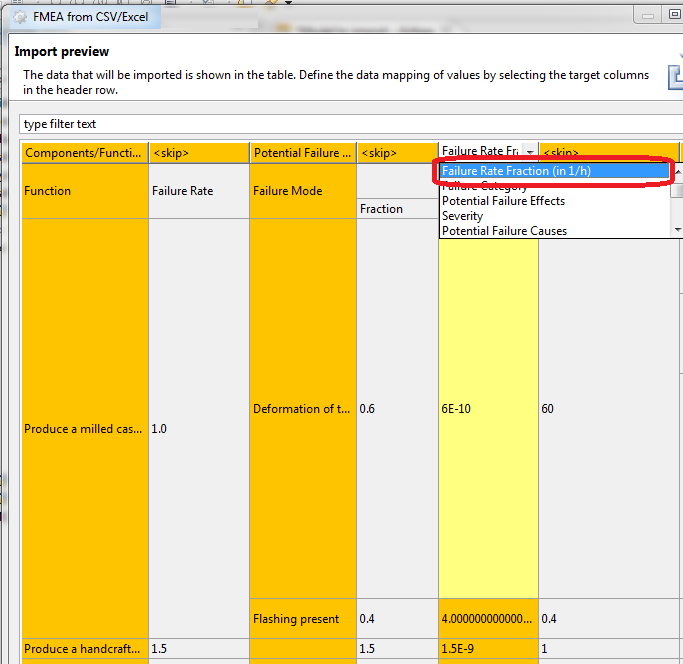
by specifying the failure fraction of the individual failure modes either in FIT or in 1/h
Both options cannot be mixed. If a column of the Excel is mapped to a property of either option 1 or option 2, the other mappings are not offered any more. In order to switch the way of import back to the other option, the mapping has first to be removed by setting it back to "<skip>", before the other properties are available as mapping targets again.
An import of option 1 is shown in the following figure.
An import of option 2 is shown in the following figure.
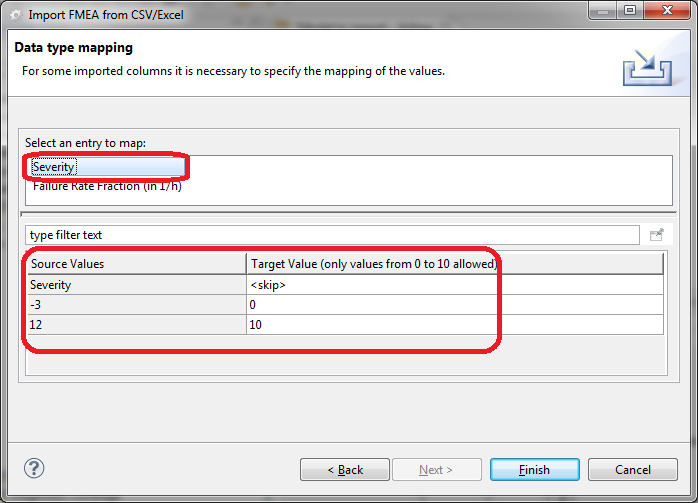
Value mapping
In some cases it is also necessary to map the data values which are found in the Excel columns to be imported to values that are supported by medini analyze. This is necessary for those columns where the target values in medini analyze are not plain text but enumerators. An example is the column "Severity" where medini analyze supports values from 0 to 10 only. If the column to be imported contains other values, you can use the data type mapping to map those allowed values. If no mapping is specified (target value: "<skip>"), these values are ignored during the import.
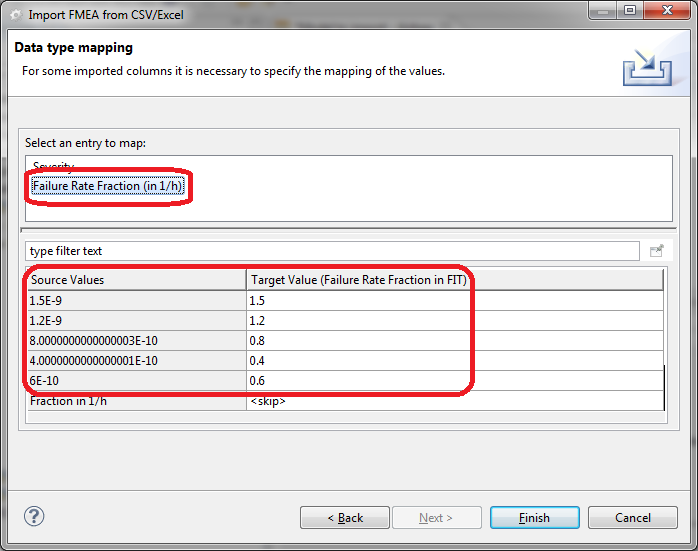
A special case is the column "Failure Rate Fraction (in 1/h)". If this column is specified as mapping target, medini analyze automatically converts the values to failure rate values in FIT. This mapping is also visualized in the data mapping page.
The import is initiated by clicking the Finish button.
Copy and paste of FME(D)A worksheets is supported inside the same project. Thereby, copying a worksheet derived from a System/Function Model (any function, function group, component, etc.) means the creation of a copy of the worksheet data, not the system design information. The copy will reference the same design model elements and only create a copy of the data that is specific to the worksheet and not synchronized with the design model. For example, that means that an FME(D)A attached to a SysML model will not duplicate the components/parts, failure modes, causes/effects, but only the pure FMEA related data such as RPN, design controls, actions, and so on.
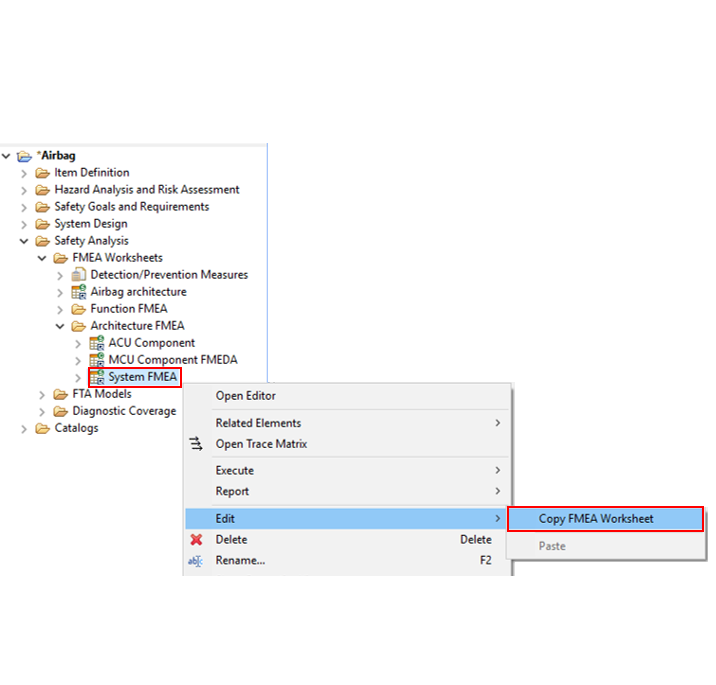
The copy and paste functionality can be triggered either in the context menu of the Model Browser or in the editor. If a worksheet is selected in the Model Browser, the context menu contains the entry "Edit -> Copy FMEA Worksheet" to initiate the operation.
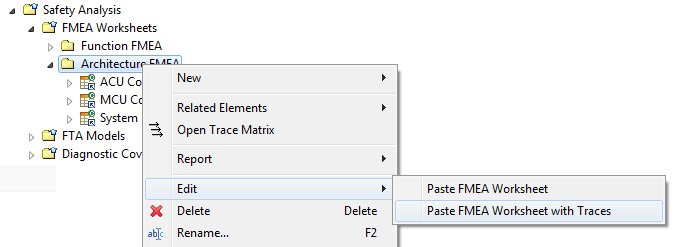
Once an FME(D)A worksheet has been copied, the "Edit" sub-menu in the context menu of any package below "FMEA Worksheets" will show two paste entries: "Paste FMEA Worksheet" and "Paste FMEA Worksheet with Traces". The first entry will create an exact copy in the selected folder, while the second option will in addition establish traces to the copies in the new worksheet whenever a trace to an element of the original worksheet is present. For example, if a trace from a safety goal to the original worksheet exists then a trace will be established to the copied worksheet as well.
An alternative way to execute the copy/paste of a worksheet is to trigger the "Duplicate" button inside an FME(D)A editor. The duplicate functionality will effectively do the same as the copy/paste menu entries, but without the possibility to select the target package for the copy (it will be the same as the original sheet).
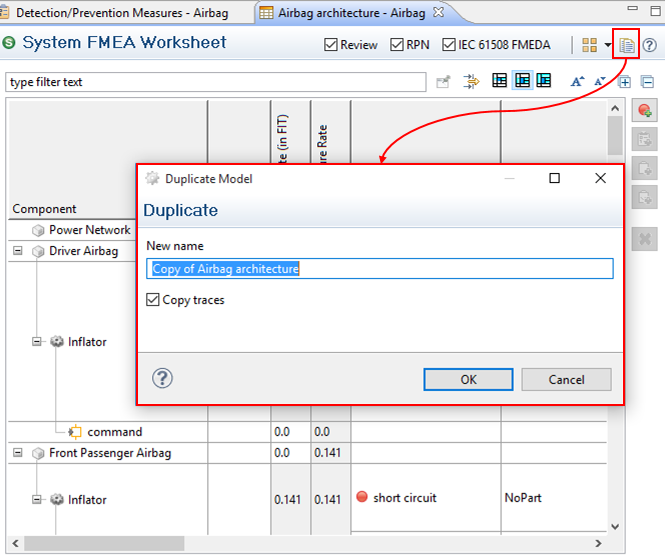
Note that the option to establish traces to elements of the worksheet copy is also available as "Copy traces" (default). Thereby, traces to the original worksheet will also lead to traces to the duplicated worksheet.
Hint: The same duplicate operation is also available by drag and drop in the model browser while pressing the "Ctrl"-key. In this case the target package for the copy can easily be selected during the drop (release of mouse button).