


The Failure Modes, Effects and Diagnostic Analysis (FMEDA) stems from IEC 61508 to analyze the failure diagnostic capabilities build into the system. ISO 26262 refines this concept by means of the Single-Point Fault and Latent Fault Diagnostic Coverage Metrics ("SPF/LF Metrics", see ISO 26262 part 5). Ansys medini analyze directly supports the application FMEDA and SPF/LF Metrics by means of a Diagnostic Coverage Worksheet (DC Worksheet). The analysis is always connected to a SysML model which defines the HW parts to be analyzed.
Note, that the Diagnostic Coverage Metrics related actions (like menu entries, editors etc.) are only available if there is a valid Premium or Enterprise license installed. Please see License Configuration for licensing issues.
The FMEDA (Diagnostic Coverage Worksheet) is only available for the safety domains ISO 26262 and IEC 16508. Please contact the Ansys medini team in case you need to use the worksheet in conjunction with other safety domains.
The FMEDA/DC Worksheet editor consists of three pages (tabs):
Cover page: Allows you to configure the analysis worksheet, especially the details about the view, i.e. which parts and variants are analyzed, target values, etc. See ISO 26262 SPF/LF Metrics Configuration and IEC 61508 FMEDA Configuration for details.
Worksheet page: Contains the spreadsheet with the analysis itself, refer to Usage of the FMEDA Worksheets for specifics you need to know.
SM Coverage page: Provides an overview on the applied safety mechanisms and gives you some statistics, see Safety Mechanism Coverage Analysis for more details.
In order to create an FMEDA Worksheet for the SPF/LF metrics of a SysML model you can either:
Choose a SysML model or element from the Model Browser and select the Derive -> Diagnostic Coverage Worksheet... from the context menu
Choose a package (or sub-package) that has the kind "Diagnostic Coverage" in the Model Browser and select New -> Diagnostic Coverage Worksheet... action from the context menu
Choose a safety goal from the Model Browser and select the Derive -> Diagnostic Coverage Worksheet... from the context menu
In all cases, a creation dialog is opened which asks for name, target package, safety goals, and target of the metrics. The target package for the worksheet and the SysML model (or an element) are mandatory:
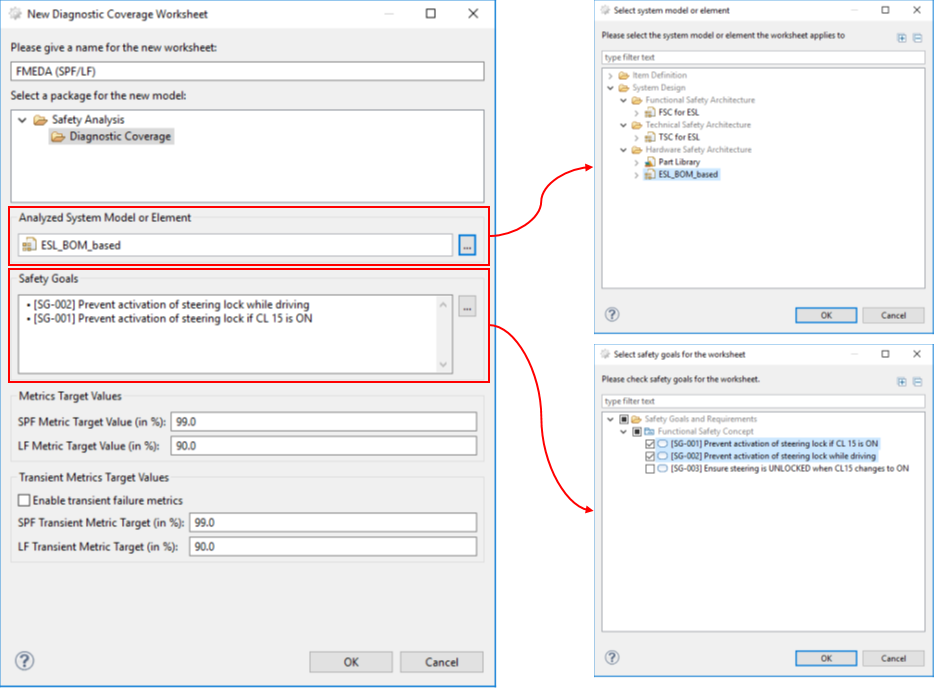
Depending on how the creation was triggered the fields are pre-selected. As alternative the metric target values can be set manually (e.g. for an Safety Element out of Context analysis).
Generally, the ASIL value of the safety goal determines the required target values for the metrics. By default, the target values are taken from ISO 26262-5 as shown below:
| ASIL | Single-Point Fault Metric | Latent Fault Metric |
|---|---|---|
| B | ≥ 90.0% | ≥ 60.0% |
| C | ≥ 97.0% | ≥ 80.0% |
| D | ≥ 99.0% | ≥ 90.0% |
Different target coverage in percentage can be provided for SPF and LF metrics by manually overriden them. Moreover, metrics for permanent and transient failure (soft errors) can be distinguished.
In order to create an FMEDA for the computation of the Safe Failure Fraction (SFF) and Diagnostic Coverage (DC) of a system you can:
Choose a SysML model or element from the Model Browser and select the Derive -> FMEDA Worksheet... from the context menu
Choose a package (or sub-package) that has the kind "Diagnostic Coverage" in the Model Browser and select New -> FMEDA Worksheet... action from the context menu
In all cases, the "New FMEDA worksheet" dialog is opened. The target package for the worksheet and the SysML model (or model element) are both mandatory.
The Cover page in an FMEDA (Diagnostic Coverage) Worksheet contains all information to setup your analysis. The header section is common to ISO 26262 and IEC 61508 and contains general information such as:
Design: reference to the SysML model/element to which the worksheet is linked (i.e. derived from). All changes in the model or the worksheet will by synchronized
Kind: documentation of the type of analysis (selection has no effect on the contents of the worksheet)
Metrics at level: determines which part of the model will be seen and analyzed on the worksheet page, see Selecting the level of analysis for more details
Team, Team Leader, Sheet Number, Creation and Revision Date: general fields for documentation purpose
The remainder of the Cover page depends on the safety domain and contains specific settings as explained in the following ISO 26262 SPF/LF Metrics Configuration and IEC 61508 FMEDA Configuration.
The handling of multiple variants is explained in Analysis of Variants in FMEDA.
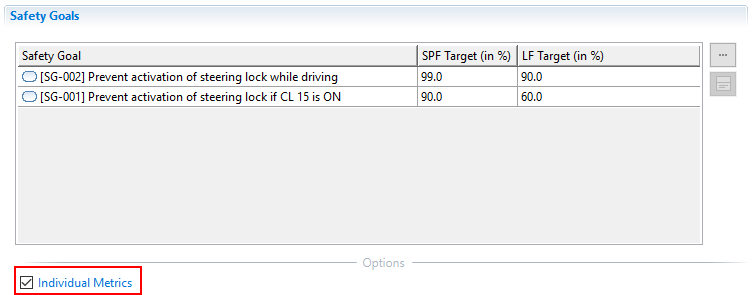
The Safety Goals table shows the analyzed safety goals including the SPF/LF target values according to their ASIL. The targets for each safety goal is taken from the ISO 26262 (cp. FMEDA for ISO 26262).
The targets for the overall worksheet is shown in Metrics Target Values. On initalization, the worksheet will use the highest number of SPF/LF values from all safety goals. With the buttons on the right side of the safety goals list it is possible to change the safety goals and their values:
Select or de-select one or more safety goals and associate them to the DC worksheet ("..." button).
Show the details of a selected safety goal in the table ("Details" button).
Propagate the target values implied by the ASIL of the safety goal(s) to the DC sheet ("Propagate" button). This action will overwrite any manually defined target values. The highest values of any safety goal in the list will determine the target value to be applied.
Note that the default values can be manually overridden at the worksheet as required for each safety goal. Values that diverge from the ISO 26262 defaults are highlighted (cell background color). Moreover, target values can also be given for ASIL A or even QM safety goals. If required, values can be reset to defaults by right click on the cell and selecting "Reset metric target value to its default".
The handling of multiple variants is explained in Analysis of Variants in FMEDA.
Options
The Cover page provides multiple options that influence the visual appearance and metrics in the worksheet:
Individual Metrics: Option that allows to distinguish different target values for multiple safety goals. Please refer to Analyzing multiple Safety Goals for more details on how to setup an analysis for multiple safety goals.
Show only safety mechanisms edited in this worksheet: When other worksheets exists over the same set of model elements, this option prevents a (visual) change in the current worksheet. See Analyzing multiple Safety Goals for more details.
Enable transient failure metrics: By default all failure modes of type transient are not included in the HW metrics calculations. If this option is enabled, all transient failure modes are considered for analysis and lead to separate SPF/LF metrics for transient as well as a combined SPF/LF metric of permanent and transient. Please refer to SPF/LF for transient failures for more details.
Compute IEC 61508 metrics: The option toggles an additional computation of the Safe Failure Fraction (SFF) and DC values in addition to the SPF/LF metrics. It might be used for projects that have both ISO 26262 and IEC 61508 requirements.
Hide transient failures: The worksheet shows all failure modes of type PERMANENT and TRANSIENT by default. This option allows to hide the TRANSIENT completely from the worksheet. The option is not available if transient metrics are used.
Hide ports except when tagged with: Option to hide (exclude) all ports from the calculations. When selected, all ports are hidden. To include certain tagged ports in the worksheet instead of hiding them, enter the corresponding tag(s) in the accompanying text field. For more information about tagging, see Tagging Elements.
Example
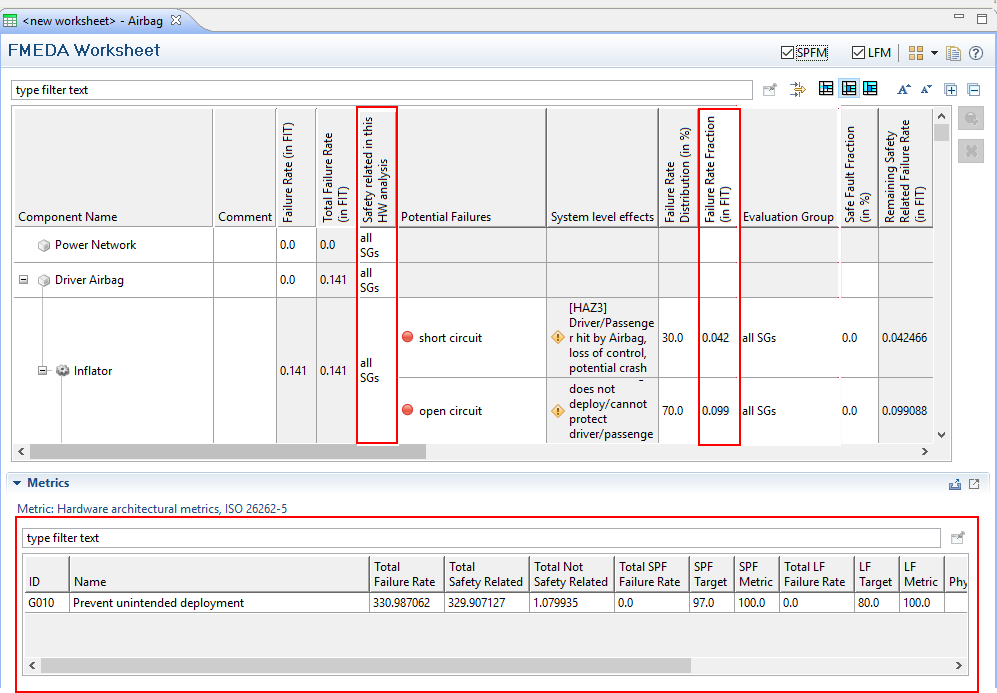
The following screenshot shows a simple setup of a worksheet for one safety goal:
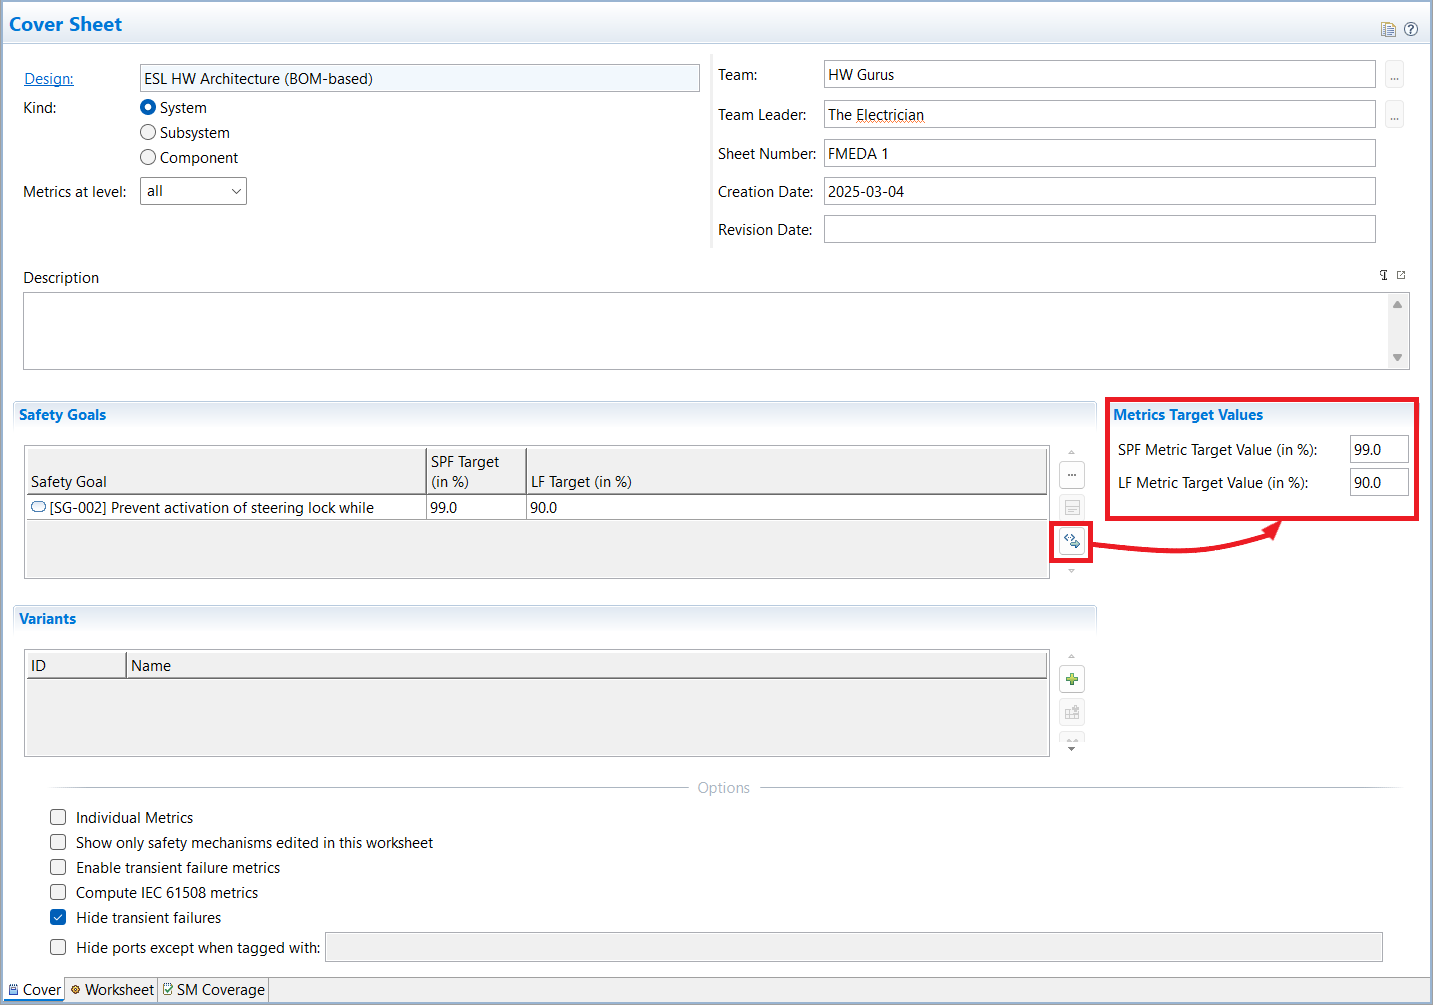
The FMEDA is linked to a SysML model named ESL HW Architecture (BOM-based) that contains all HW components. Since the model contains hierarchically grouped circuit parts, the option Metrics at level is set to "leaves". The worksheet table will hence provide spanned rows for all intermediate elements of the containment hierarchy and list all components with failure modes and the lowest level.
The safety goal here is just a single one and no variants are configured.
For an IEC 61508 project, the Cover page provides the following additional options:
Show only safety mechanisms edited in this worksheet: When other worksheets exists over the same set of model elements, this option prevents a (visual) change in the current worksheet. Note: the safety mechanisms are assigned to the underlying failure modes, and hence are also shared. By default, they become visible in every worksheet, unless this option is enabled.
Include transient faults: By default all failure modes of type transient are not included in the SFF/DC calculations. If this option is enabled, all transient failure modes are considered as well.
Compute IEC 61508 metrics: The option is always on to compute the Safe Failure Fraction (SFF) and DC values. This option might be de-actived in future versions of the tool if customized metrics are available.
Hide transient failures: The worksheet shows all failure modes of type PERMANENT and TRANSIENT by default. This option allows to hide the TRANSIENT completely from the worksheet. The option is not available if transient faults are included in the FMEDA computations.
Hide ports except when tagged with: Option to hide (exclude) all ports from the calculations. When selected, all ports are hidden. To include certain tagged ports in the worksheet instead of hiding them, enter the corresponding tag(s) in the accompanying text field. For more information about tagging, see Tagging Elements.
The handling of multiple variants is explained in Analysis of Variants in FMEDA.
SysML models support containment of parts and structured models by nesting parts inside others. For example, the HW components in a Bill of Material (BOM) might be contained in a HW model that defines the circuits in a hierarchical manner or a chip design could contain multiple levels of parts, sub-parts, sub-sub-parts, etc. While this is a key advantage in the model, it can be a problem in the FMEDA/HW Metrics, which is defined for a flat list of components only.
For this purpose the option Metrics at level provides a means to select the appropriate level that shall be considered for the diagnostic coverage analysis. The option works as follows:
Level set to "all" (default): all elements of the containment hierarchy are shown. All parts are treated as linear list for the computations of the metrics.
Important note: there are certain cases when failure rates might be counted twice (or more often)! For example, if a failure rate is distributed to contained children, marking both the parent and the content "safety related in this analysis" will consider the same failure rate at different levels (theses cases are usually highlighted by the tool). See also the Ansys medini analyze Safety Manual for more details.
Level set to a number n: all elements contained at the given level n are used for calculation (starting with 1 for the first level, 2 for the second, and so on). Nevertheless, the worksheet shows the hierarchy so that the localization of elements becomes easier (similar to packages).
Level set to "leaves": In case the hierarchy of model elements is unbalanced and certain components have a deeper nesting than others, this option allows to select all leaf elements of the containment tree. This allows the maximum flexibility for designs where e.g. the BOM is contained at different levels of the model.
The metrics level can be changed at any time without loosing information of the analysis. You can go to the worksheet page and check whether the relevant elements are shown, then come back to adjust the option, and so on. We recommend anyway to set the level prior to the execution of the analysis. Although the data is kept in the worksheet when changing the level, it might be tedious to start working on a selected level and repeating parts of the analysis at a different level later on.
The main analysis is conducted in the table on the "Worksheet" page of the editor. As shown in the picture below, entries for all elements in the analyzed model are automatically created and synchronized with the underlying model. Depending on the visulization option on the cover page, the table shows only a limited set of elements at a certain level and provides separate metrics for transient failures. See FMEDA Worksheet Configuration for more details.
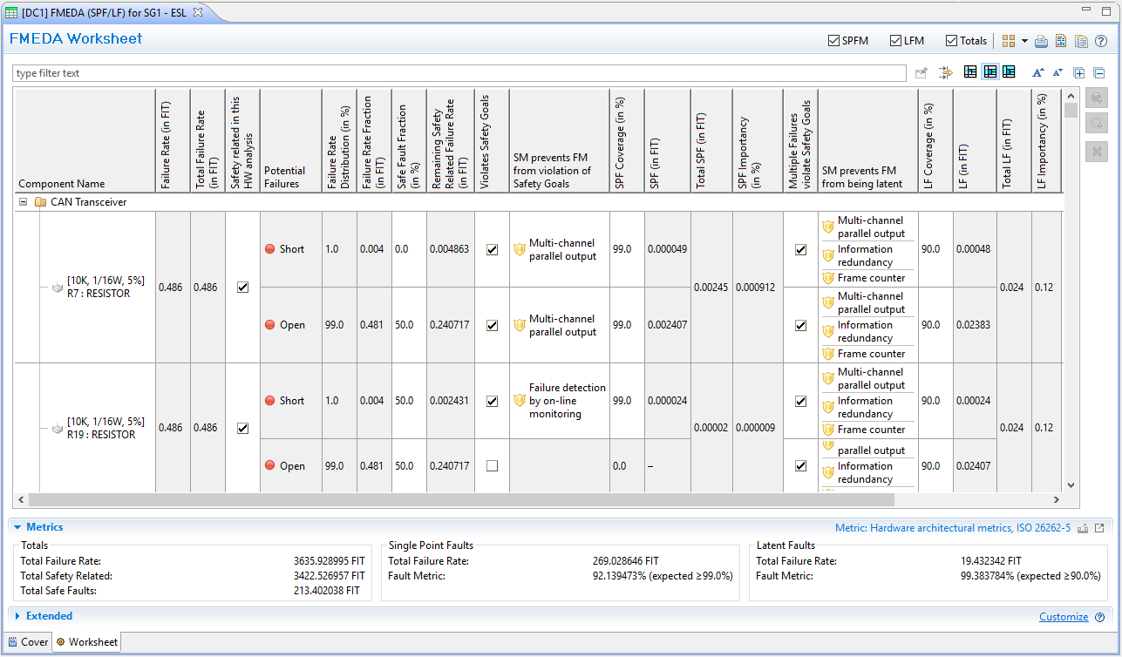
The worksheet contains the analysis table and additional sections for the metrics and extended properties depending on the safety domain.
Metrics: This area shows the SPF/LF metrics and/or SFF/DC values that are computed automatically by the tool based on the inputs seen in the table above.
Extended Area: If additional properties for Worksheets have been defined, these properties will appear here (see Profiling mechanism)
Note that these two sections are only visible when clicking on the triangle in front of the section. Clicking again will hide the corresponding section and make more screen space available for the worksheet.
The worksheet's table lists the components, failure modes, failure rates, failure mode distribution, failure rate fraction (of each failure mode), and safety mechanisms. All changes on this part are performed on the model (not only in the worksheet).
The column "Component Name" shows the containment hierarchy of components. The "+" and "-" signs can be used to fold and unfold the content of a package or component.
The worksheet for ISO 26262 shows the SPF/LF values in the metrics section. The analysis can be done by editing essentially the following information:
Each component that appears is considered in the metrics if it is checked as "Safety related in this HW analysis". Note that only safety related components are used for calculations of metrics! This is independent of their nesting level.
Note that a component may be considered safety related in the current worksheet and not in another (e.g. different safety goal in ISO 26262). Therefore the setting made at the system element is used as default in the worksheet but can be changed in each worksheet individually. If the underlying System/Function Model element is marked differently, the cell will be colored orange (color can be adjusted in the preferences).
Each failure mode which belongs to a safety related component needs to be analyzed as part of the metrics. You have to decide whether the failure mode has the potential to violate the safety goal and the percentage of safe faults. The safe fault fraction is local to the analysis (i.e. worksheet). The remainder of the failure rate (subtracting safe fault fractions) will go into the SPF metric.
The safety mechanisms detecting a failure mode and preventing the violation of the safety goal is entered next including its diagnostic coverage (DC). Note that this link is created at the failure mode in the analyzed model. As a consequence, if for the same analyzed model another DC Worksheet is derived the same safety mechanisms will appear there.
The safety mechanisms can be selected from catalogs as described see Safety Mechanism usage in the Worksheet.
All subsequent columns are for the latent fault metric, i.e. whether the failure mode has the potential to violate the safety goal in combination with another independent failure. The column "Multiple Failures violate Safety Goals" must be checked in this case. Note that the LF metric depends on the SPF analysis in the same row, i.e. whether there is a residual fault or not.
The safety mechanisms allowing to prevent the failure modes from being latent can be selected including its DC. Again, this link will be created at the failure mode in the analyzed model. The mechanisms can be selected from catalogs as described below.
You may want to extend the worksheet entries by additional failure modes as well as define cause and effect chains among the failure modes. This is explained in Failure Modes - Causes and Effects.
medini analyze automatically computes following values for failure modes (values are read-only and cannot be changed by user):
Single-Point Fault Failure Rate: the failure rate left uncovered for single-point fault
Single-Point Fault Importancy (in %): the contribution of the particular failure mode towards the overall single-point fault metric in %. This can be used for optimization purpose.
Latent Multiple-Point Fault Failure Rate: the failure rate left uncovered for latent fault
Latent Multiple-Point Fault Importancy (in %): the contribution of the particular failure mode towards the overall latent multi-point fault metric in %. This can be used for optimization purpose.
The same importancy columns are available for transient failure modes if transient metrics are enabled.
In the metrics area the metric values are visualized:
Total rate of failures for the system, including all components that appear in the table
Total rate of failures for safety related components, i.e. those marked as "safety related in this analysis"
Total rate of failures for not safety related components
Total rate of single-point failures for the system
Single-Point Fault Metric
Total rate of latent failures for the system
Latent Fault Metric
If the option "Enable transient metrics" is on, these values will be shown for permanent and transient failure rates separated and in combination. The formulas applied for the computation are defined by ISO 26262, part 5:
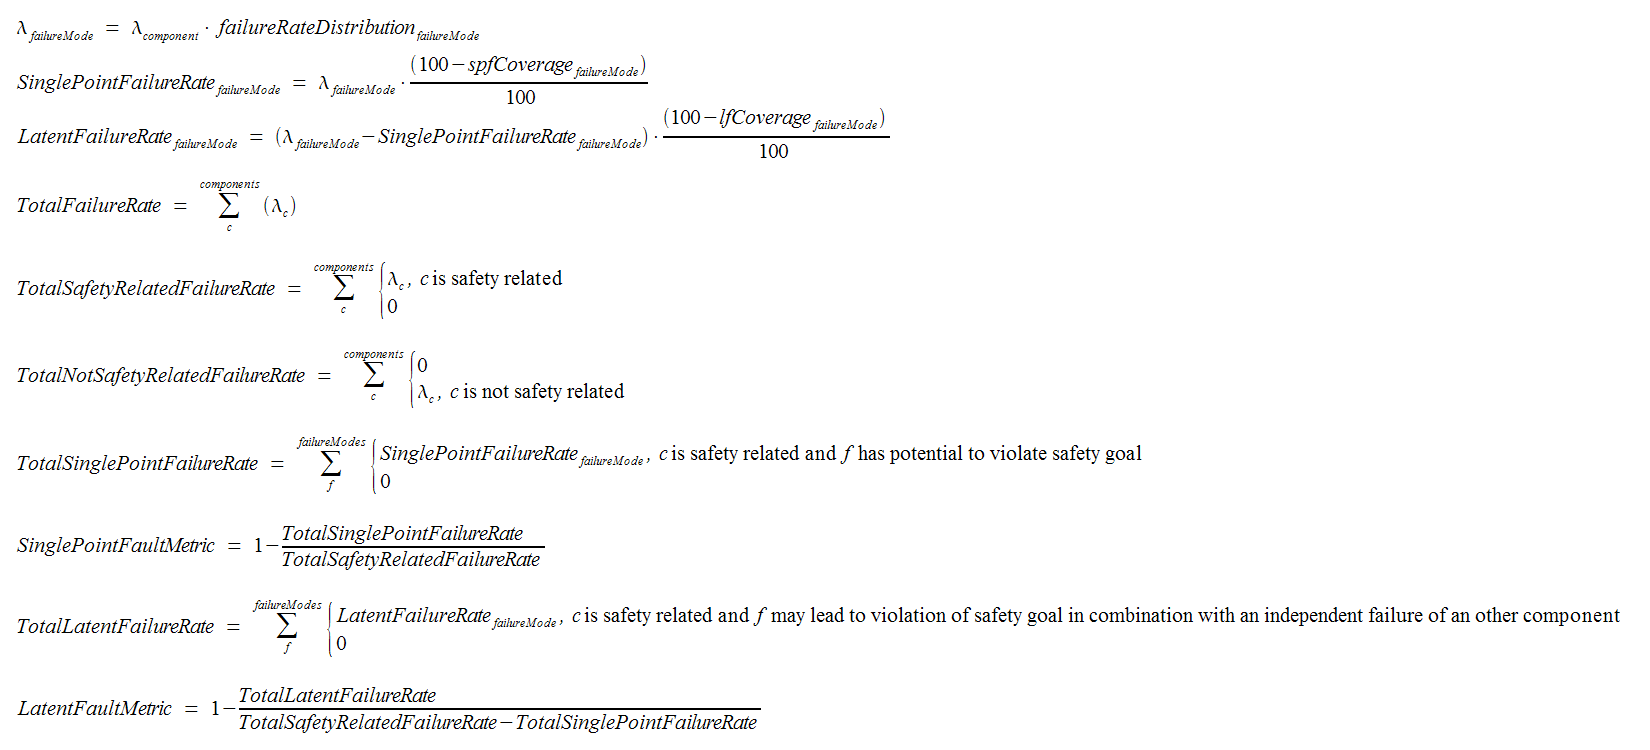
Note, that the tool visualizes the metric values (SPF and LFM) in percentage. That means, the values calculated with the above formula are multiplied by 100.
The worksheet for IEC 61508 shows the Safe Failure Fraction (SFF) and Diagnostic Coverage (DC) in the metrics section. The analysis can be done by editing the following information:
Each component that contributes to the SFF/DC must be checked as "Safety related in this HW analysis". Note that only safety related components are used for calculations of SFF/DC, all others are considered as "No part" failures.
A component may be considered safety related in the current worksheet and not in another (e.g. different usage context). Therefore the setting made at the system element is used only as default in the worksheet but can be changed in each worksheet individually. If the underlying System/Function Model element is marked differently, the cell will be colored orange (color can be adjusted in the preferences).
Each failure mode which belongs to a safety related component needs to be analyzed whether it is dangerous or not. For each failure mode a safe fault fraction can be given, which is local to the analysis (i.e. worksheet). The remainder of the failure rate (subtracting safe fault fractions) will be considered as the dangerous failure rate for the SFF/DC calculations; the safe fraction is added to the SFF, accordingly.
Note that non dangerous failures are considered as "No part" failures according to IEC 61508.
The available diagnostics can be assigned in the column "Safety Mechanism (Diagnostics) including its diagnostic coverage (DC). Note that this link is created at the failure mode in the analyzed model. As a consequence, if for the same analyzed model another FMEDA is derived the same safety mechanisms will appear there.
The safety mechanisms can be selected from catalogs as described below in Safety Mechanism usage in the Worksheet.
medini analyze automatically computes following values for failure modes (values are read-only and cannot be changed by user):
Dangerous Undetected Failure Rate: These are the undetected dangerous failures after diagnostics.
SPF Importancy (in %): the contribution of the particular dangerous undetected (i.e. single point failures) to the total undetected dangerous in percent. This can be used for optimization purpose.
In the metrics area the metric values are visualized:
Total rate of failures for the system, including all components that appear in the table
Total rate of failures for safety related components, i.e. those marked as "safety related in this analysis"
Total rate of failures for not safety related components
Safe Faults failure rate
Dangerous failure rate
Dangerous Detected failure rate
Dangerous Undetected failure rate
No part failures
Safe Failure Fraction
Diagnostic Coverage
If the option "Include transient metrics" is on, the transient failure rates will also be included in the analysis.
In the FMEDA/Diagnostic Coverage worksheets you can select safety mechanisms from a catalog or configured mechanisms already existing in the project. Please see Safety Mechanisms and Predefined Catalogs for general description of safety mechanisms catalogs.
Double clicking in a cell for safety mechanisms will open a dialog to allow selecting mechanisms. The dialog shows all mechanism in catalogs and mechanisms which are existing in configurations in the current project.
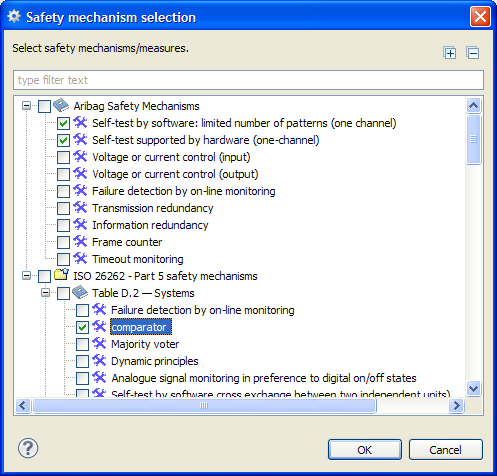
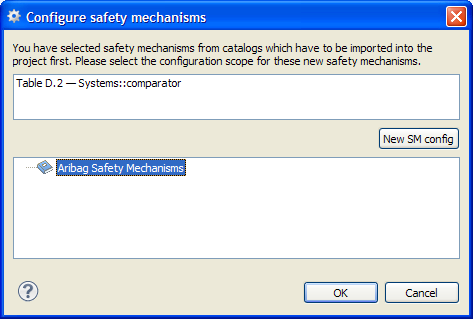
If a safety mechanism is selected from catalog the mechanism is added to a safety mechanism collection ("configuration") in the project. Therefore you are asked to provide a mechanisms collection to add the mechanism to.
The Safety Mechanism (SM) Coverage page provides a condensed summary on the safety mechanism used in the analysis. The table will collect all safety mechanisms from the same editor's worksheet page and show information such as the diagnostic coverage over all entries and covered failure rates. To see the page, just open the "DC Worksheet" editor and select the page "SM Coverage", see Creation of FMEDAs for more details.
The page lists all visible safety mechanisms and their combinations as they appear in the worksheet. The table provides the following columns:
ID(s): ID assigned to the safety mechanism. If multiple safety mechanisms are combined, the IDs will concatenated with a "+" (plus) symbol.
Safety Mechanism(s): Shows the name of the safety mechanism (label with icon). If multiple safety mechanisms are applied together, a list is shown. You can use the context menu "Show element(s) in Browser" to locate them in the project.
N° of FMs: This column shows the number of failure modes that the safety mechanism(s) are applied to. This gives you an idea on the criticality or usage profile for the SM.
SPF DC (in %): The diagnostic coverage that is estimated for the SM according to the analysis. If the safety mechanism is considered to have different coverages for certain failure modes, a range is shown in the form [<lowest DC>..<highest DC>]. The default DC assigned to the safety mechanisms is given in parentheses. Note that this column exists separately for permanent and transient failures.
If the worksheet uses the option "Individual metrics" to assess multiple safety goals in the same spreadsheet, the range that is shown provides the lowest and highest DC numbers across all safety goals. See Analyzing multiple Safety Goals for more details on the behavior of the option.
LF DC (in %): This column provides similar information for the latent fault diagnostic coverage, also separated for permanent and transient failure modes.
SPF FIT covered: The covered failure rate over all failure modes to which the safety mechanism is assigned is shown here. The "covered failure rate" is the remaining failure rate of the failure mode after safe faults multiplied by the DC assigned to the failure mode (in FIT).
If the worksheet option "Individual metrics" is turned on and there are different DCs for different safety goals, this column shows a range such as [<minimum FIT covered>..<maximum FIT covered>] over all safety goals.
LF FIT covered: Similar information for latent faults considering the remaining failure rate that is going into the LF metric and that is covered by a safety mechanism for latent faults.
Example
The screenshot below shows an example of the SM coverage summary. As can be seen, single safety mechanisms such as "Sensors Correlation" appear in the table as well as combinations, for example "Frame counter, Information redudancy, Multi-channel parallel output".
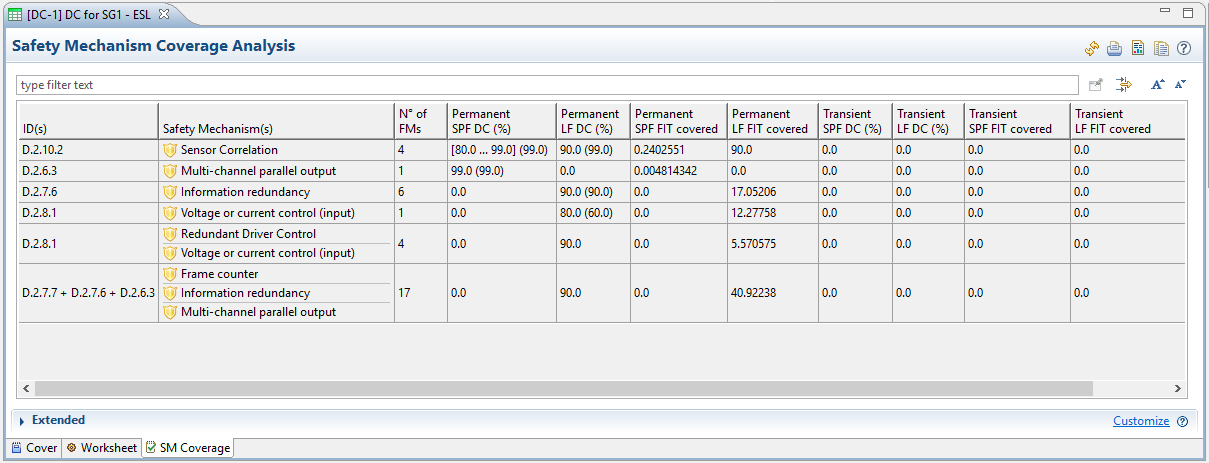
The number shown in "N° of FMs" count to how many failure modes the SM(s) is applied to (which are visible in the worksheet!). If the safety mechanism is applied alone and in combination with others, the entries are counted individually. For example, "Information redundancy" was assigned to six failure modes in the analysis and to another 17 in combination with "Frame counter" and "Multi-channel parallel output".
The SPF and LF diagnostic coverage columns show either a single value or a range of values. In this example "Sensor Correlation" has been applied to four failure modes with different DC for single point faults, ranging from 80% as lowest to 99% the highest. As default, this safety mechanism has set 99% DC as indicated in parentheses. For latent faults, a consistent DC of 90% is applied in all cases although the default has been estimated to be 99%.
Note that you cannot see from the "Number of failure modes" how many single-point and how many latent faults are addressed separately, only the combined number is shown. In this example, the "4" for "Sensor Correlation" means that overall there are four entries that use the SM either for SPF or LF detection. This combined entry is due to the assumption that SMs for single-point and latent faults are anyhow separated in most of the cases.
The covered failure rates provides a quantitative figure on how important the safety mechanism is. We see for example that "Sensor Correlation" covers approx. 0.24 FIT whereas "Mulit-channel parallel output" covers only two orders of magnitude less (here: 0.004814342 FIT). Similarly for latent faults, the combination of "Frame counter, Information redudancy, Multi-channel parallel output" covers the largest portion with approx. 40.9 FIT of latent faults.
Note that you can use ordering of a column to rank the entries from lowest to highest or vice vera by clicking on the header of the column. The normal table filters work, of course, in the well-known way.
Safety mechanisms can be deactivated from an FMEDA analysis. Deactivation means to basically hide or remove them from an FMEDA and clear failure mode entries they are assigned to. For example, if an FMEDA is adapted to a system context, certain safety mechanisms might not be applicable and hence should be removed from the analysis.
In order to deactivate (i.e. remove) a safety mechanism from an FMEDA do the following:
Open the DC Worksheet (FMEDA) editor and switch to the "SM Coverage" page. For more details see Safety Mechanism Coverage Analysis.
Select the safety mechanisms to be deactivated using the checkboxes in the first column of the SM table
Click the "Deactivate" button on top of the table. Note that there are three options to influence the behavior on how the deactivation should take place (small triangle drop down beside the button):
Metrics to be cleared: All metrics (i.e. SPF and LF), SPF only, or LF only
Failure mode types to be cleared: Permanent, Transient, or both
Hide or unassign: Hiding the safety mechanism will keep its assignment to the failure mode and only deactivate and clear the current FMEDA worksheet. If unassign is selected, it is removed from the failure mode. Note that hence it will be cleared from all other FMEDA worksheets as well!
Important: Note that "deactivation" does not mean that a safety mechanism is temporarily toggled off so that it can be later back turned on. A once deactivated SM can only be activated by undoing the deactivation directly after this action has been triggered!
By default each diagnostic coverage worksheet computes one single point fault (SPF) and one latent multiple faults (LF) metric for all safety goals and checks them against the target values given on the editors' cover page. Hence, if multiple safety goals are added to a worksheet, the analysis is not differentiating potentially lower SPF/LF targets, if e.g. one safety goal is ASIL D while others are ASIL C or B.
If multiple metrics with different target values need to be calculated, analysts have basically two options:
Create multiple worksheets, for each safety goal a separate one. This organization is useful in case safety goals are unrelated and/or if multiple users work in parallel on different safety goals. That means each worksheet provides a separate view for the safety goal on the same data and they share all structural information about the elements, failure mode, failure rates, and so on. Note: the safety mechanisms are assigned to the underlying failure modes, and hence are also shared. By default, they become visible in every worksheet, unless the option "Show only safety mechanisms edited in this worksheet" is enabled:
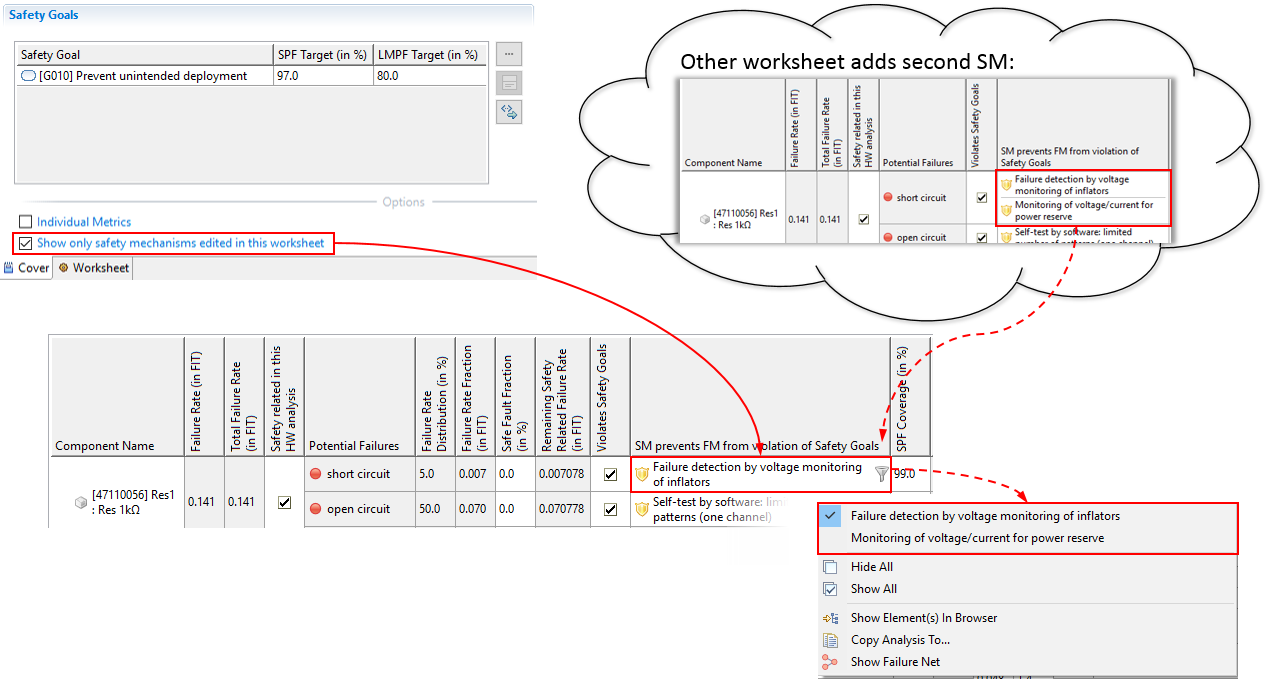
This option prevents safety mechanism from automatically appearing in the current editor when added in another worksheet. If required, however, they can be shown later by disabling the filter (see below).
Turn the option "Individual Metrics" on for a diagnostic worksheet to compute multiple multiple metrics in a single worksheet. This is useful e.g. if one worksheet shall contain the complete analysis of (a part of) the system.
The remainder of this section will explain the changes in the behavior of the worksheet editor for the second case. Please refer to Usage of the FMEDA Worksheets for an general overview on the usage of the editor.
Checking the option "Individual Metrics" will enhance the table on the "Worksheet" page so that it is capable to differentiate metrics per safety goal. The option changes the worksheet with respect to the following:
The column "Safety related in this HW analysis" will allow the filtering of safety goals for which a HW component is considered. Therefore the simple checkbox is replaced by a list of safety goals. By default an entry applies to all safety goals.
An additional column "Evaluation Group" is added to the table to select a list of safety goals to which a failure entry applies. Hence, the "Violates Safety Goals" and "Multiple Failures violates Safety Goals" will only be taken into account for the selected goals.
The Metrics summary section will show the list of all safety goals with individual metrics based on the settings of the two columns listed above. If variants exist, the full combination of "variants x safety goals" will be shown in the metrics section.
Note that the evaluation group concept is shared with the handling of variants as described in Analysis of Variants in FMEDA. That means you can flexibly group failure mode analysis entries for a set of variants and safety goals. The tool UI will make sure that you did not assign a safety goal or variant twice per failure mode.
Example
Note that this option can only be activated and not unchecked (except Undo). After enabling the "Individual Metrics" the worksheet will look like shown in the following:
As seen from the screenshot the two columns "Safety related [in this HW analysis]" and "Evaluation Group" determine together to which safety goal failure entries of the analysis apply to. It is important to understand that the "Evaluation Group" can contain always only a subset of the safety goals selected as "Safety related" which in turn are a subset of the safety goals of the worksheet. In other words the metric evaluations use the stepwise filtering of an entry by:
Safety goals at worksheet -> Safety goals for HW component -> Safety goals applicable to failure entry
For example, if a component is only safety related with respect to one safety goal, this goal can be selected by double click in the corresponding cell for "Safety related" (here Res1 applies only to G010):
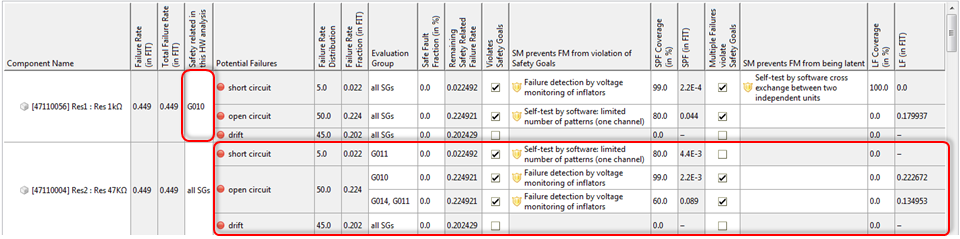
In this case the "Evaluation Group" is not further constraint and all failure mode entries apply to G010 (implied by 'all SGs'). Note that the "Safety related" column is used to compute the total safety related FIT of the SPF/LF metrics, so effectively the FIT rate of Res1 will be considered only for G010.
If a failure mode applies only to a subset of the safety goals, the cell "Evaluation Group" can be limited to this subset (by double click using a selection dialog). Here in this example "Res2 - short circuit" would only violate safety goal G011.
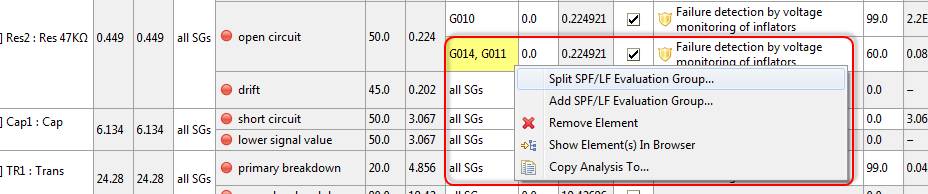
If safety goals need to have different safety mechanisms and/or diagnostic coverage, the evaluation group can be split. In the example "Res 2 - open circuit" has two evaluation groups:
Group one for "G010" with a diagnostic coverage of 99.0%. This leads to adding only 1% of the failure mode's FIT to the SPF metric.
Group two for "G014 and G011" with a diagnostic coverage of 60.0%. This leads to adding only 40% of the failure mode's FIT to the SPF metric.
For each group the columns for safe fault fraction, violation of safety goals (SPF and LF), safety mechanisms (SPF and LF), diagnostic coverage (SPF and LF), and the computed values such as remaining failure rate after coverage and importancies are different.
Splitting the evaluation of the analysis can be triggered via the context menu. Right click and choose "Split SPF/LF Evaluation Group..." on the cell like shown below:
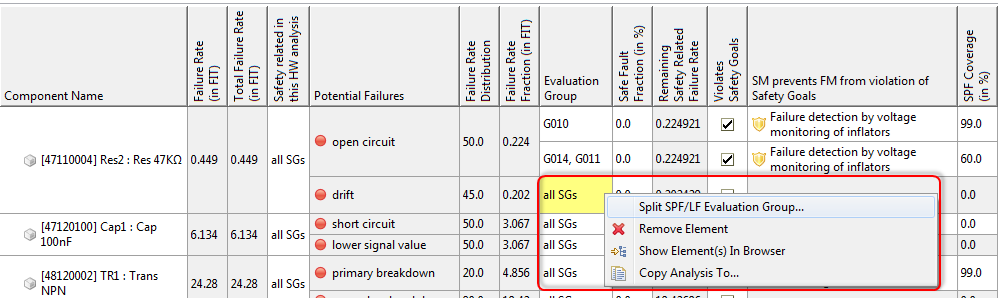
This menu entry will open a dialog in which the safety goals of the worksheet can be selected to which the entry is evaluated for:
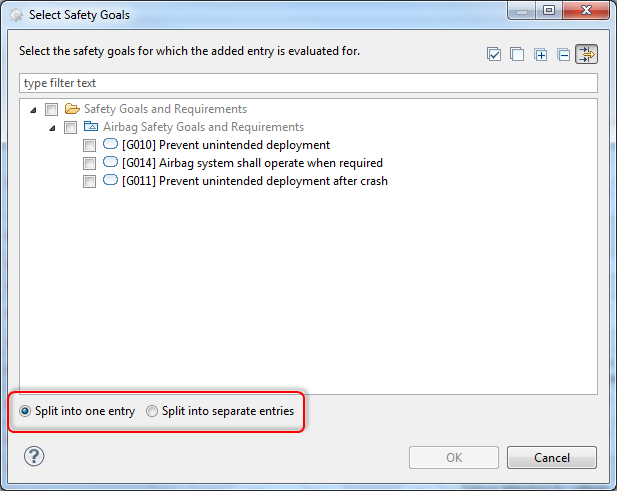
Select the safety goals for which the group defines the SPF/LF parameters. The dialog provides the option to create a single entry or separate evaluation groups per selected safety goal. Note that the dialog shows by default only the filtered safety goals according to the "Safety related" column and/or worksheet. Removing the filter (button in the top right corner) allows to choose any safety goal of the project to quickly widen the "Safety related" column and even add additional safety goals to the whole worksheet.
If variants would exist, in addition the possibility to split along variants is available. Each evaluation group is then shared and can focus on a set of variants. This gives you maximum flexibility in grouping subsets of the overall product of "variants x safety goals".
After splitting into multiple evaluation groups these can be further altered by double clicking in the cell and (de-)selecting safety goals. Moreover, groups might be subsequently splitted, new groups added and existing ones removed via the context menu:
The number of groups is only limited by the safety goals listed at the HW component entry (and hence the worksheet itself).
The tool will ensure that the same safety goal is not associated to more than one group in the context of a failure mode. Therefore context menu entries for split/add might not be available, depending on already associated safety goals. Moreover, during deletion of safety goals from a project a check ensures that this integrity constraint is maintained and if not, deletion will be prevented.
The FMEDA cover page provides a section to list variants which you can distinguish in your analysis. A variant is basically defined by an ID and name so that it is available in the worksheet itself. The list of variants is local to the worksheet and can be dynamically adjusted as required.
Note that the use of variants makes only sense, if the underlying HW model (SysML) contains components of multiple variants (sometimes referred to as "150% model") or if variation points exist in terms of the safety mechanism/failure mode analysis itself.
If you add variants on your FMEDA cover page the behavior of worksheet will change as follows:
A new column "Variants" will appear in the worksheet. This column lets you select the applicable variants for each component. By default, every component is assumed to be used in all variants. If you select only a subset of all variants, the component will be conisidered not part of the variant and e.g. the failure rate will not be counted for the non-listed variants.
A new column "Evaluation Group" will show up on the level of failure modes. The group allows you to detail the analysis of each failure mode with respect to the variants. For example, if a failure mode is handled differently by safety mechanism that depend on the variant you can split the analysis and list the variations separately (see below).
The Metrics section on the worksheet page is automatically turned into a table that lists all metrics and targets per variant. Both of the settings above for Variants and Evaluation Group effectively work as a filter for the metrics, so that only components and failure modes are counted that are assoiated to a variant.
The "Evaluation Group" allows you to tailor the analysis for each failure mode as follows:
Firstly, the group allows to select the applicable variants for the failure. By default, the failure mode applies to all variants selected for the component. If you want to narrow down the safety impact/safety goal violation, simply pick only the variants to which the failure mode is critical to.
Secondly, the evaluation groups allow you to split the analysis for each failure mode. If you right click on the group cell and select "Split SPF/LF Evaluation Group", you can introduce two (or more) rows for the same failure mode which are bound to a (subset of the) variant(s). That means you can set individually the safe fault fraction, safety mechanisms, and diagnostic coverage (SPF and LF) for each variant in the same analysis.
The tool UI will guarantee that the evaluation groups do not overlap, i.e. each variant appear only in one group per failure mode.
Note that the evaluation groups are a common concept that is shared with the "Individual Metrics" option as explained in Analyzing multiple Safety Goals. Find more information there how you can combine variants and safety goals.
Transient failures can be separately quantified and evaluated as SPF/LF metrics in the DC worksheet. As precondition, failure modes have to be explicitly marked as TRANSIENT and quantified by a transient failure rate (see Failure Mode Properties for details).
Transient SPF/LF analysis can be enabled in the Cover page of the DC Worksheet:
Checking the option will show additional columns and fields for the target values of the SPF and LF metrics. These target values behave in the same way as the permanent SPF/LF metrics and the evaluation option Individual Metrics is applied to both metrics, i.e. permanent and transient SPF/LF (see Analyzing multiple Safety Goals).
The worksheet will change upon selection and show additional target values in the Metrics section:
Now all transient failure modes are considered in the corresponding transient fields, i.e. totals for the worksheet (Transient Failure Rate, Transient Failure Safety, and Transient Failure Safe Faults) as well as the SPF/LF metrics section (Transient SPF/LF Failure Rate, Transient SPF/LF Metrics). For convenience, overall metrics for the combination of permanent and transient is shown as well.
When assigning a safety mechanism to a transient failure mode, the "Transient Diagnostic Coverage" values for SPF and LF are assigned by default, respectively.[12]
Components and failure modes that appear in the worksheet of the DC model are synchronized with the related System/Function Model. Nevertheless, it is possible in the worksheet to add or delete failure modes here for convenience (if the element is not typed). Using the worksheet manipulate failure modes will directly change the corresponding System/Function Model elements.
Adding failure modes can be done by selecting an component entry in the worksheet and using the "Add failure mode" button on the right side of the worksheet.
With the "Remove" button, an existing failure mode can be deleted. Again, it is also deleted from the corresponding System/Function Model.
The causes and effects of a failure mode are also editable in the worksheet (see also Working with the failure net). This is done by a selection dialog or by drag and drop from the Model Browser in the corresponding columns. The selection dialog opens either by double-clicking the causes or effects cell of a failure mode:
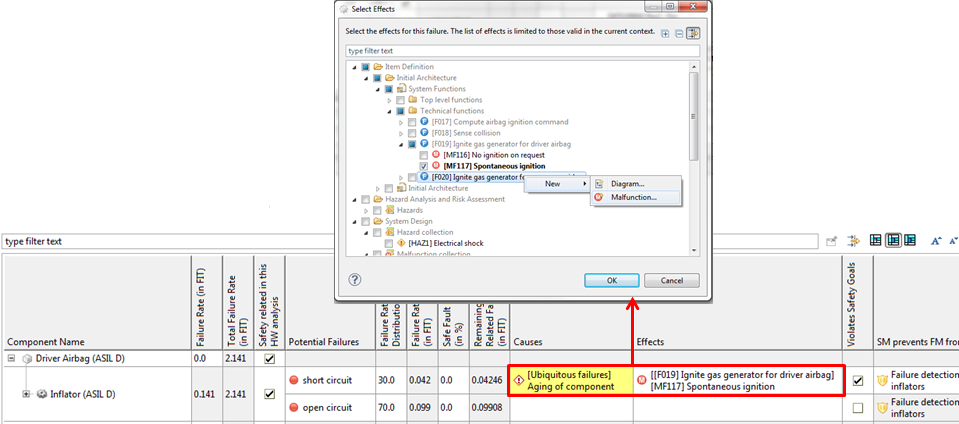
Note that in the selection dialog it is possible to create new failure modes, malfunctions, hazards, etc. on the fly using the context menu. If new elements are created, a name can be assigned immediately while further details must be edited later, after closing the dialog.
In case multiple failure modes are selected as Causes or Effects, they are shown in one cell as list separated by a horizontal line.
Copy and paste for FMEDA (Diagnostic Coverage) Metric worksheets is supported and behaves in the same way as described for FME(D)A worksheets in Copy and Paste for FMEA worksheets.
Beside copy and paste of a complete FMEDA (Diagnostic Coverage) worksheet, it is also possible to just copy individual analysis results, for example for a selected failure mode or a selected component. Results can be copied within a worksheet or across worksheets.
The action "Copy Analysis To" can be triggered either on a failure mode entry or a component entry. In both cases a target selection dialog comes up to ask for one or more targets to copy the results to. When copying from a failure mode, only failure mode entries of the same worksheet can be selected as targets, same holds for components: copying from a component means only components can be selected as targets. The source elements of the copy operation are visible in the target selection dialog and shown in bold font to make navigation easier, however they cannot be selected. There are several advanced options in the dialog to tweak the operation in either or the other way.
On execution, analysis result values are copied from the source to all targets (depending on options and target type). In case the source was a failure mode for example, all values go directly to the target failure modes. In case the source was a component, the operation searches for matching failure modes in the target (failure modes with the same name) and copies the values from the source failure mode to the target failure mode.
Example 7.1: An Example
The source component X has three failure modes, 'open', 'short' and 'drift', the target component Y has two failure modes, 'short' and 'other': the operation will copy values from source 'short' to target 'short' only
By default only targets in the same worksheet can be selected. However, there is an option (a toggle in the dialog toolbar) to let the user switch from "Select within the worksheet" to "Select from 'any compatible' worksheet" in the project. Once pressed, all 'compatible' worksheets are shown in the selection dialog. Compatible means:
Both worksheets must have the same state of the "Individual Metrics" option and
must have the same list of safety goals
Note that otherwise a worksheet is not shown in the selection dialog.
Ansys medini analyze has a dedicated export wizard to extract FMEDAs (DC Worksheets) to make an analysis available in a "stand-alone" project. This exported analysis can be fully customized and adapted, but it does not include the full project content, but only the information relevant to the FMEDA (i.e. "transitive closure"). For example, if a the SPF/LF HW metrics is completed and needs to be handed to application engineers or customers that need to adapt the analysis for a specific application e.g. mission profile or SM configuration, this wizard allows you to export and share the minimum of model information that is required (potentially protecting detailed design IPs).
The export wizard can be triggered from the context menu of a project. Note that this feature is currently only available with the "Semiconductor Enterprise" license:
Select a project in the Model Browser and right click to open the context menu
Open the sub menu "Export" and select "DC Worksheet(s)..." to open the export wizard
The first page "Target Project Selection" lists all projects of the workspace. Choose one project into which the worksheet and related content will be exported to. Usually this is an empty project or one that has been prepared with application specific information.
Note that any existing content in the target project is preserved! This allows you to add default contents for the recipient of the exported project, such as documents, mission profiles, checklists, requirements, etc.
Click "Next" to get to the "DC Worksheet Selection" page that will show all analysis worksheets of the current project on which the export has been triggered. Select one or multiple DC sheets which shall be exported.
On pressing "Next" the tool will compute all dependent information related to the selected worksheets. Especially the SysML model on which the analysis is based on as well as safety goals, libraries, mission profiles, and so on are determined. This might take a while for larger projects and a progress bar indicates the steps during resolution of dependencies.
After completion, the page "Additions" shows the content that will be added to the target project. By default the absolute minimum of model content that is mandatory for the DC worksheet/FMEDA to work will be selected. These elements cannot be de-selected, since otherwise the model integrity would be broken. You can browse the content to inspect what would be exported.
Note that selection of additional content is possible. Just remove the filter to see the full project contents (filter button above content viewer) and check all additional models or objects you want to be include in the export.
Press "Next" to trigger the export based on the selected content. This will run another dependency check for newly added content and eventually merge everything into the target project. The result page will list all changes that were made to the exported project.
After completion of the wizard, all the DC worksheets and content are available in the target project and can be fully accessed and manipulated. Make sure to save the this project so that changes are persisted. The export can be reverted by undo or simply discarded if not saved. Re-export is also possible, in case you forgot something or need to add another worksheet.
Note that medini analyze provides a dedicated DC Configurator license to allow additional users to modify such exported DC Worksheets/FMEDA. For more information, check with the Ansys sales and support team on further license options.
[12] Note that with versions earlier than 19.2 there has been no distinction between permanent and transient DC. In any case these are only defaults and the numbers relevant to the computation are those shown in the table of the worksheet.