


The Panel Contribution option enables you to visually compare the results of one or more solid bodies as a mosaic chart. You use this feature to create a "panel" for each body included in your model. However, you can only scope the supported result to the faces of a body. Using these faces, the application calculates results for each panel (body) included in the face-based scoping.
Panel Contribution is available only for the waterfall diagram and frequency response result types, and for only two analysis types, Harmonic Acoustic (Waterfall Diagram only) and Harmonic Response analyses.
Go to a section topic:
Result Types Supporting Panel Contribution are based on Analysis Type
The result types that support the Panel Contribution option are based on the analysis type you select, and include:
- Harmonic Response
For a Harmonic Response analysis, the Panel Contribution option supports the following results:
Waterfall Diagram: , , , .
Frequency Response: , , , , .
- Harmonic Acoustic
For a Harmonic Acoustic analysis, the Panel Contribution option supports the , , , .
Apply Panel Contribution
Select a supported result type.
In the Details pane, set the Panel Contribution property (Panel Contribution category) to .
Specify the scoping of the supported result. Scoping Method property options include:
: Displays an associated Geometry property. Use this property to pick a desired face or faces on the model.
: Displays an associated Named Selection property. Use this property to select a desired face-based Named Selection from the drop-down menu.
: Displays an associated Named Selections property. Use this property to display the drop-down menu, press and hold the [Ctrl] key, and select multiple face-based Named Selections from the list.
Face selections for a Named Selection must be included in a single body.
Right-click the result and select .
For the and options, the application automatically creates a panel for each body contained in the scoped geometry. For , each Named Selection defines a panel.
Viewing the Panel Contribution
When you set the Panel Contribution option to , the Chart and Tabular Display category displays the Display Panel property. Set the Display Panel property to to view the mosaic chart referencing the panel contribution.
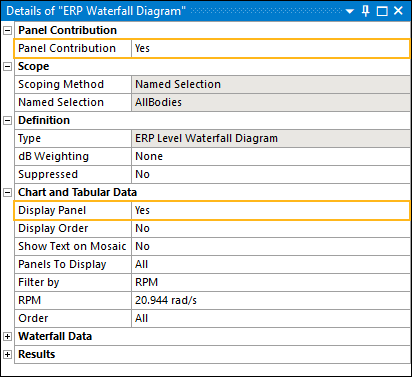
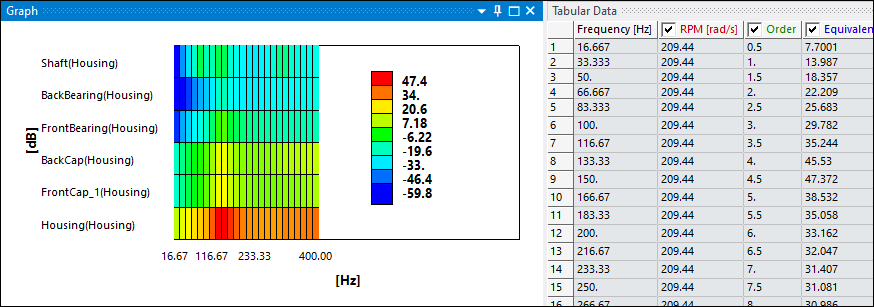
The mosaic chart displays frequency values versus result values, such as decibels (dB), as shown below.
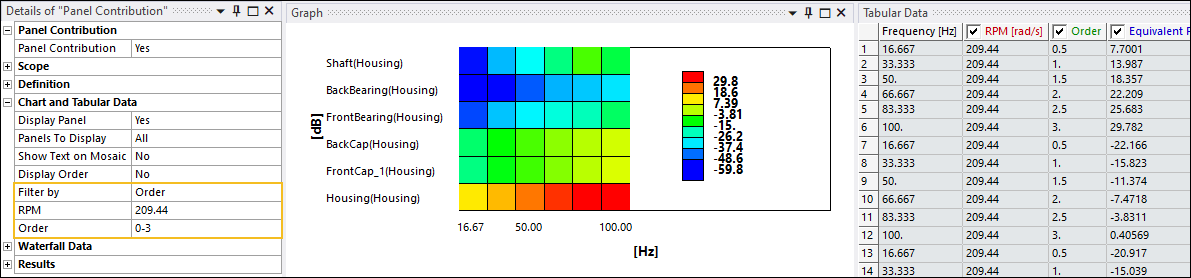
The result data displayed in the in the Graph and Tabular Data windows is based on the selection of the Filter By property, either or , the RPM value you specify in the RPM property, and how you filter the RPMs or orders using their entry properties. Based on your entries, the result data replots accordingly. Here is an example of result data filtered by Order, for a specific RPM and a range of order values.
The graph displays result values along the Y-axis. As stated, when using the Panel Contribution option, you must scope the result to faces, either through direct geometry selection or using face-based Named Selections.
When you scope a result directly to geometry or to an individual Named Selection, the chart labels the Y-axis with the name of the body or bodies corresponding to the specified geometry or Named Selection, as shown above.
If you scope a result to multiple Named Selections, the chart labels the Y-axis with the name of each specified Named Selection.
Additional Details pane properties related to the panel contribution, under the Chart and Tabular Display category, include:
Show Text on Mosaic: Display the result values of each frequency for the panels. Options include (default) and .
Panels to Display: Select the number of panels you want to display. The default option is set to . Otherwise, enter a value for the number of desired panels to display. A value other than displays the number of panels based on your entry. To reset the property to , enter zero (
0).The application displays the panels based on which panels have the highest peak value (the maximum value of a row). For the mosaic chart, the bottom row represents the top panel and for the tabular data, the top panel is located in the first row or rows, followed by the second, third panel, etc.