For a multi-step Harmonic Response analysis that specifies RPMs as the step type, the application supports the following waterfall result options:
(also available for Motion analysis)
(also available for Motion analysis)
Far-field Sound Power Level Waterfall Diagram and Far-field SPL Mic Waterfall Diagram (Acoustic Waterfall Diagrams)
Note:
Because waterfall diagrams plot large amounts of data, the application provides several features, such as zoom and the use of probes, to manipulate the display. See the Waterfall Diagram Display Features below for more information.
You can specify a weighting filter (A, B, and C) for the result.
Waterfall diagrams based on a Motion analysis use a Short Time Fourier Transform (STFT) algorithm. See Results and Result Tools (Group) in the Mechanical Object Reference for details of the associated parameters.
Tip: The Velocity and Acceleration waterfall diagrams currently support mesh-based scoping as a beta feature.
Waterfall Diagram Display Features
Because Waterfall Diagrams can plot significant amounts of data, display features exist to examine and present the data to suit your particular needs. The Waterfall Data category of the Details pane for a result contains these display features.
Select the titles below to see how each option/property affects the display.
Zooming
The worksheet for waterfall results include a small box in the lower left-hand corner, as highlighted below. Use this box to zoom in on the diagram. Select a corner of this option and drag the cursor to enlarge the area of the diagram contained within the zoom option. A smaller control is placed inside the zoom option once you drag a corner. Use this control to pan across the diagram to change the selected zoom area. Double-click the control to return the view to the default.
Note:
Hide the display of the zoom feature in the worksheet by setting the Show Zoom Pan Control property to .
When zooming in on an area of the diagram, the values of the Minimum/Maximum X Axis and Minimum/Maximum Y Axis properties automatically update based on your selection.
In addition, as shown below, you can select the [Alt] key and then select directly in the diagram to zoom on an area. Once you [Alt] + click in the diagram, drag your cursor left-to-right to enlarge a desired area. [Alt] + click and drag your cursor from right-to-left to return the view to the default.

Specifying Probes
Use the Probe option to place probes displaying result values anywhere on the diagram. As you run the cursor over the result values, the probe displays a result value and a coordinate (X and Y) location. If you select a location that does not include data, the selection is ignored. Use the Delete option to delete probes by clicking on a probe’s anchor.
Note: Probes are automatically removed from the diagram if you 1) select a different object or 2) change the unit system.
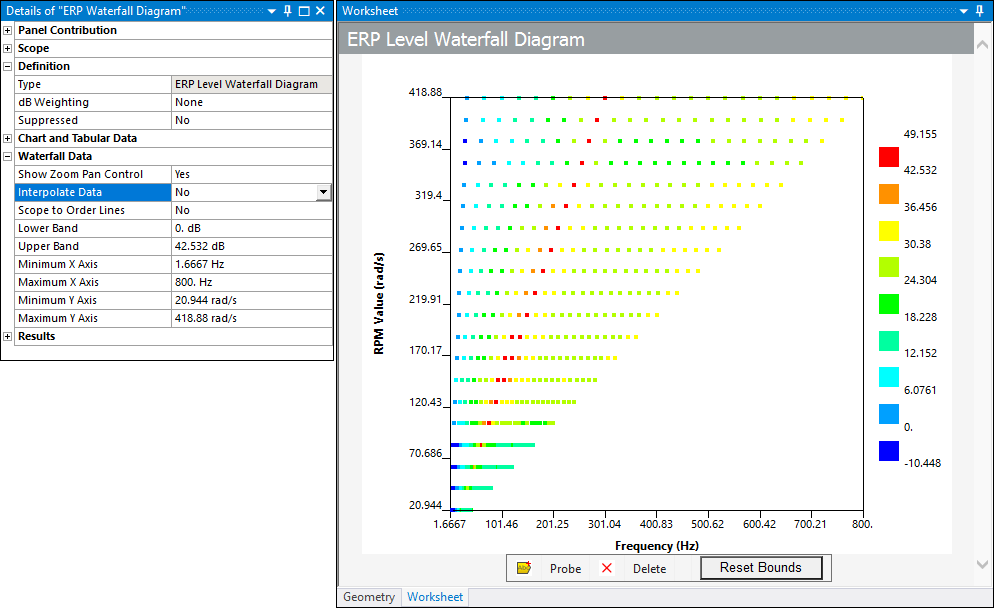
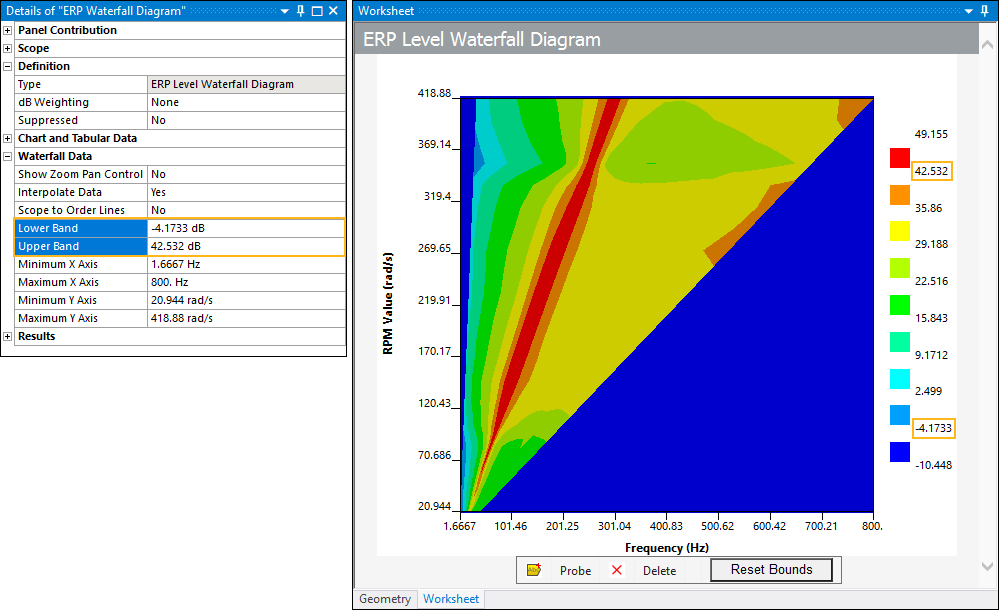
Interpolate Data
By default, waterfall diagrams display interpolated and actual values. To display only the actual values, without interpolation, set the Interpolate Data property to (the default is ).
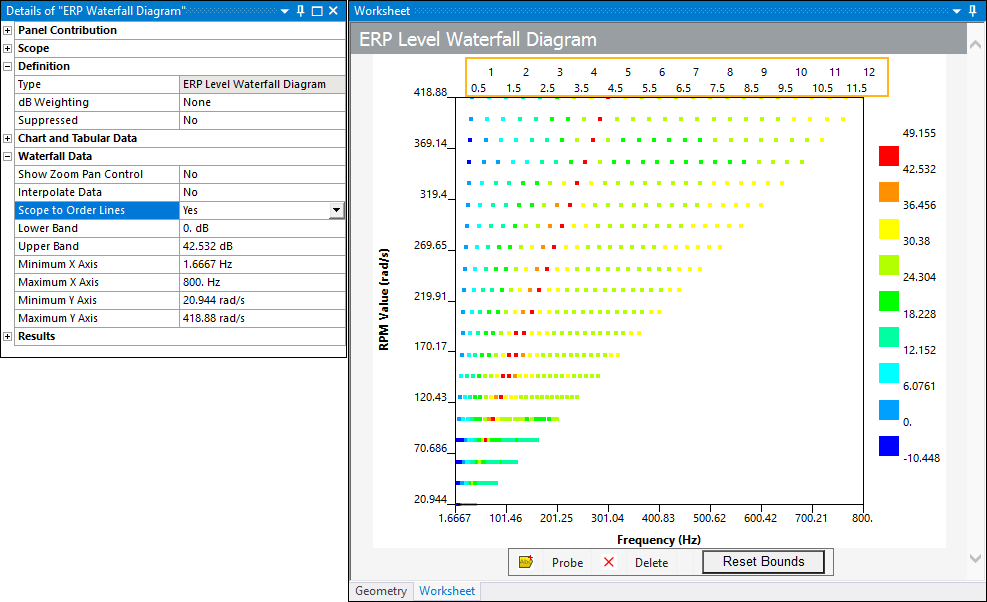
Displaying Order Lines
To display the values included in the order lines only, set the Use the Scope to Order Lines property to (the default is ).
Specifying Upper/Lower Bands
The application populates the Lower Band and Upper Band property values following the solution. These values represent a range of available data points. Not all regions of the diagram include data. Once available, you can manually specify a value for the lower or upper contour band to redistribute (in equal increments) the display. This can be beneficial when you have groupings of result data points at one end of the color assignment. Use the button on the diagram to reset changes.
Plotting Min/Max Data
The application calculates the values of the Minimum/Maximum X Axis and Minimum/Maximum Y Axis properties during the solution and automatically plots the values on the axes of the diagram. The diagram only displays values within this range. You can modify the range of these properties by manually entering frequency or RPM values presented on the diagram or in the associated result column of the Tabular Data window.
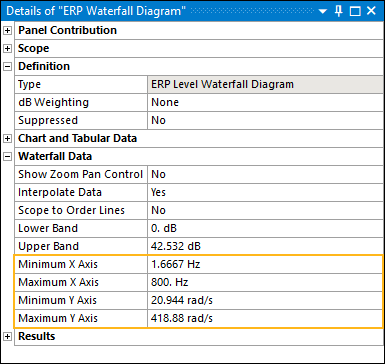
Note: These values automatically update when you zoom in or out on an area of the diagram.
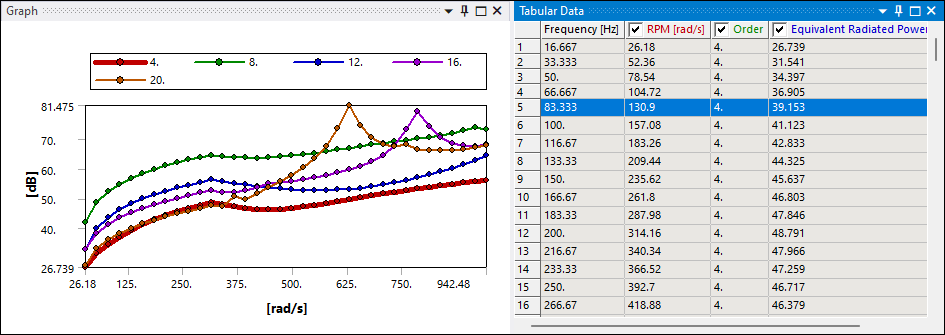
Displaying Graph Window Legend
Once you have displayed result data, you can:
Right-click in the Graph window and select (or ) to display graph annotations. This example shows a specific set or Order numbers to simplify the display.
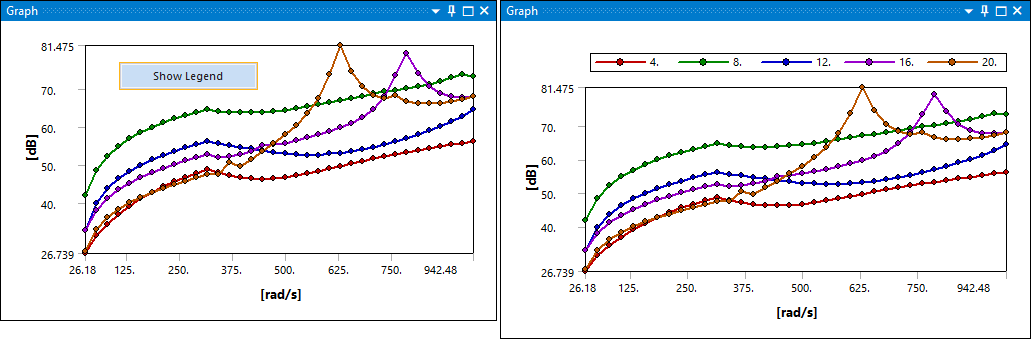
Select one or more of the numeric rows in the Tabular Data window to highlight the value(s) in the graph.
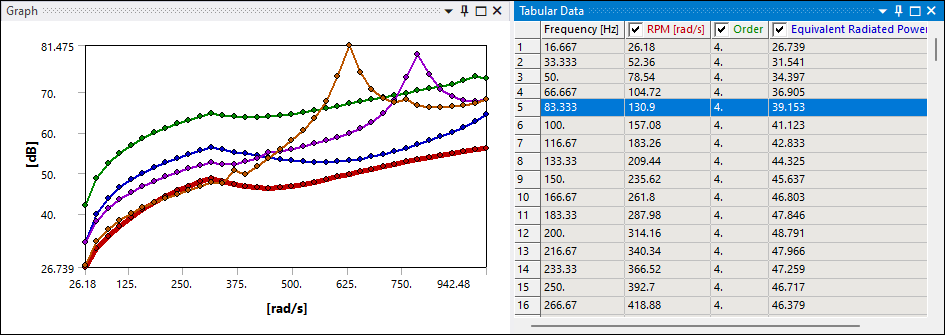
The highlight applys to the legend value as well.