


The order contribution feature enables you to filter result data and display the highest response at specific mode shapes and frequencies. This feature is only available for standalone or linked MSUP Harmonic Response analyses. This feature only supports multiple step RPMs (Multiple Step Type property set to ). You use the capabilities of this feature in combination with the following result types.
Velocity Waterfall Diagram
Acceleration Waterfall Diagram
ERP Waterfall Diagram
ERP Level Waterfall Diagram
Viewing the Order Contribution
Order contributions are always computed. When you set the Display Order property to , you see a bar chart under in the Graph window. It is recommended that you filter data orders with a single RPM value and specify a Top Orders property value for easier result interpretation.
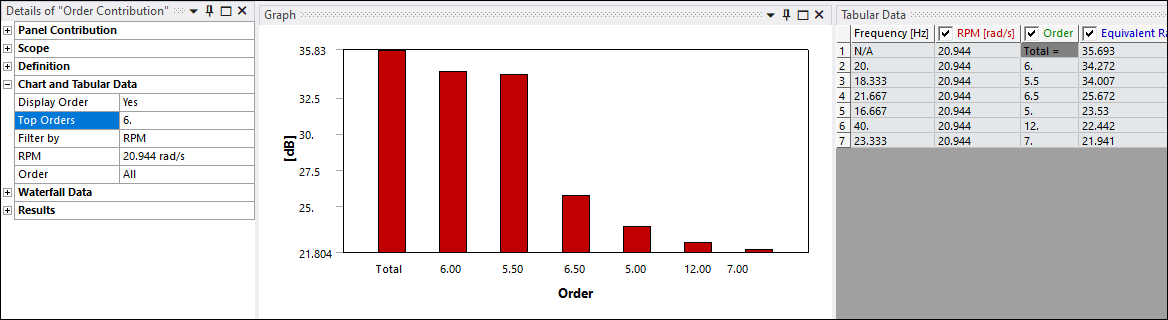
Details pane properties related to the contribution, under the Chart and Tabular Display category, include:
Display Order: Use this property to filter graph and tabular data by frequency or order for given RPM values. Options include and (default). When set to , the application displays result data by Frequency plotted in a line chart. When set to , the application displays result data by Order plotted in a bar chart.
Note: You cannot use this property in combination with the Panel Contribution option.
Filter By: Use this property to specify whether to filter the result data in the Graph and Tabular Data windows by RPM (default) or Order. These options filter result data for either setting of the Display Order property.
RPM: This is an entry property to further filter graph and tabular data using a single RPM value, multiple values, or a range of RPM values. When entering multiple values, you can separate the entries by a comma (5, 10, 20), enter a range of values separated by a hyphen (5-20), or you can enter a combination of individual and range entries, such as 5, 10, 30-40.
Order: This is an entry property to further filter graph and tabular data using a single order value, multiple values, or a range of order values. For Order property entries, you can enter multiple values, separated by a comma (12, 16, 24) as well as range values separated by a hyphen (28-40), or a combination of entries, such as 12, 16, 24, 28-40.
Note: For each order value you enter, the application includes all values within a decimal range of ±0.5 in the Graph and Tabular Data windows. For example, for the entry, 5,10 the selected order range is 4.5-5.5 and 9.5-10.5.
Top Orders: This property displays when you set the Display Order property to to filter graph and tabular data by Order. Use this property to display the "top" order values. That is, it displays those orders that most affect the result. Top orders display in descending sequence. The default setting is (entry of
0). The property supports integer value entries, for example, 5, for the top five orders.