


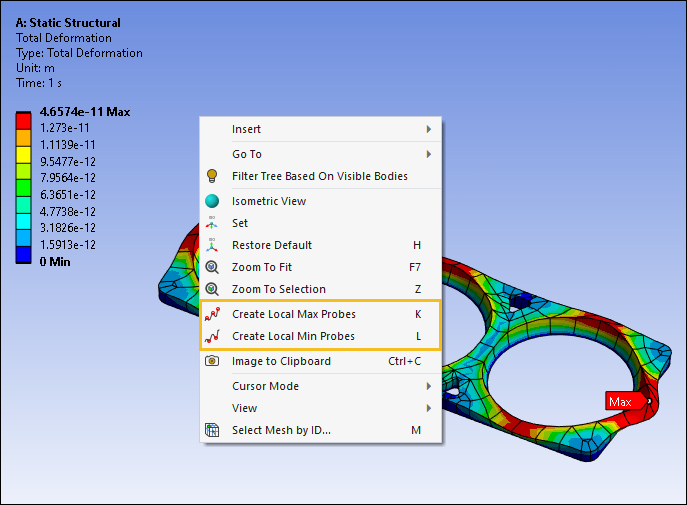
For nodal results such as displacements, and element nodal results such as stresses and strains, the application provides the context menu (right-click) options and , as illustrated below. The options are available on the menu when the Geometry window has focus. As shown on the context menu, the and keys also activate the options. Once you have probes labels displayed, re-selecting these options replots your result data or updates the locations and values if you have made a change.
Go to a section topic:
Requirements
Note the following requirements for this feature:
Only displays labels on active (not suppressed or hidden) parts.
Can only display result values available on exterior faces.
Does not support results scoped to either a Path or Surface.
Does not support beam element structure.
Note: Currently there is a beta option to Create Local Volume Min/Max Probes. Follow the link to review the documentation on this beta feature.
Probe Label Display
When activated for a selected result, the application creates probe labels at local maximums and minimums across the result's scoping. The application labels a node as a local maximum if all adjacent nodes (immediate neighbors) have smaller result values than itself. Similarly, a node is a local minimum if all adjacent nodes have larger values than itself. Specifically, a node can be a local maximum or minimum even if there are nodes on the model that have larger/smaller values than itself if they are not an immediate neighbor. For example, given a 2D model, in these sequences: 80, 90, 100, 90, 70, and 30, 40, 50, 40, 30, the application labels the values 100 and 50 as maximums because their neighbors (to left and right) have smaller values.
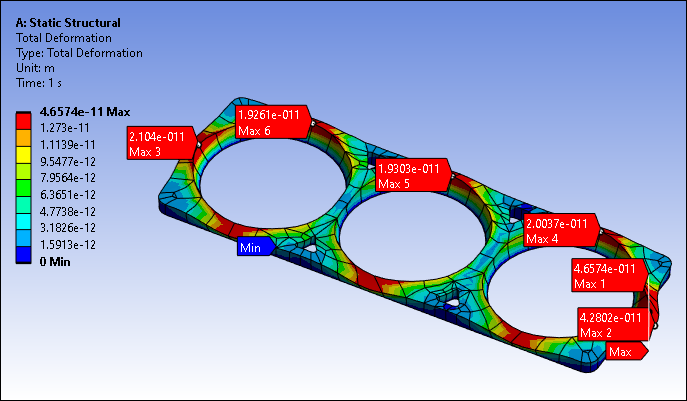
For the supported result types, note that the Max 1 and Min 1 probes are equal to the global min/max probe labels displayed using the Maximum and Minimum buttons on the Results Context tab. The example below shows maximum local probe labels. You can think of each label as a maximum for its immediate area on the model. The application creates labels only for the largest maximas (and smallest minimas) across the model, up to the limit defined by the preference.
The number of probe labels displayed is based on the amount of result data. The default value for this display is six (6) labels. As desired, you can change this default setting of the Number of Local Min/Max Probes controls in the Graphics preference of the Options dialog. You can specify the number of labels to display (for each - Min and Max) from between 1-20.
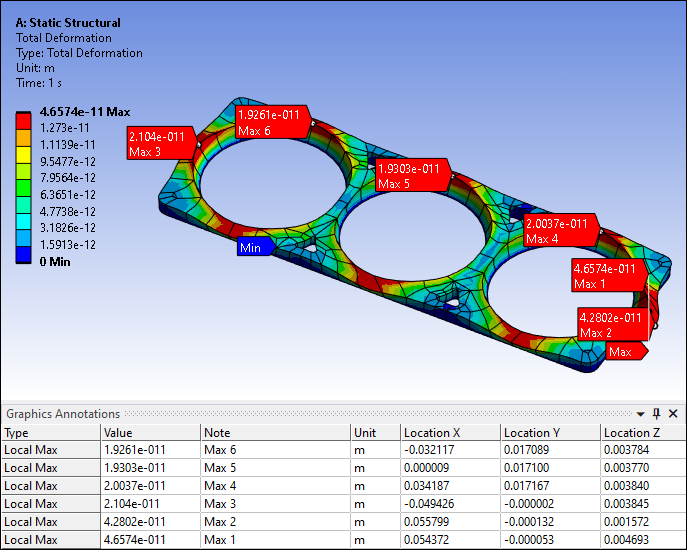
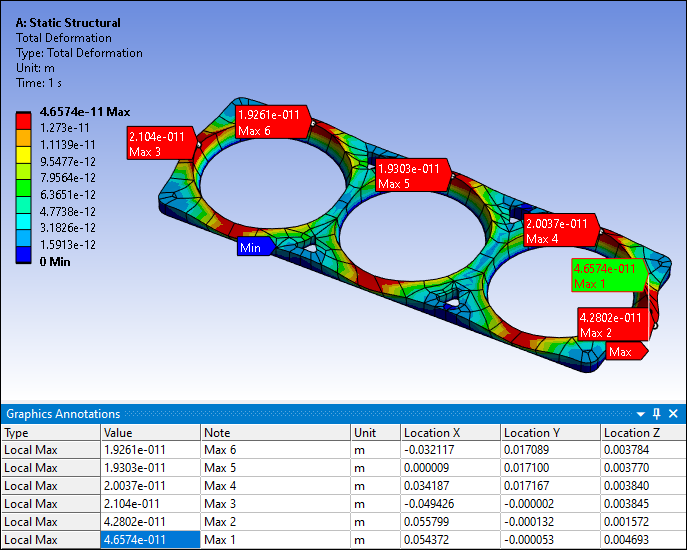
Note that the application automatically displays the Graphics Annotations Window along with the probe labels. Selecting a table cell in the Value column or a cell of the Association column or selecting the annotation label in the Geometry window, highlights the annotation in the table as well as in the Geometry window, as illustrated below.
In addition, as you use this feature to display labels from multiple results, the data is added to the Graphics Annotations window. Therefore, you may see more than one table entry with the same Note value (for example, Max 6). The Associated column displays the result object that corresponds to the row. In order to remove the labels from your Geometry window display, you need to delete them individually or all together using the delete options of the Graphics Annotations window.
Display Options
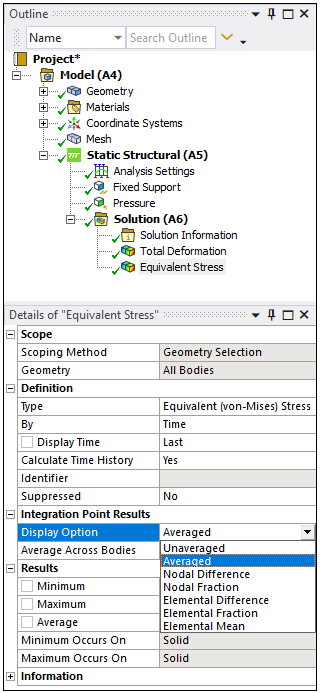
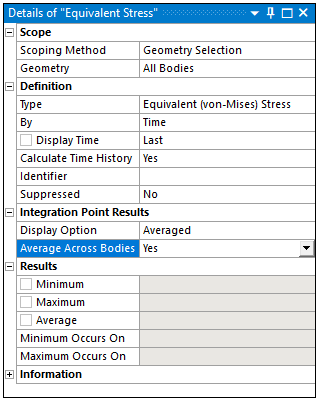
These options support nodal results and averaged element nodal results. For element nodal results, you can change the setting of the Display Options property (Integration Point Results category) in the Details view of the selected result. These maximum and minimum probe options support the following display options only: (default), , and . If you select the option , you can also set the Average Across Bodies property to to enhance the display of minimum and maximum probes if they are located at shared nodes of multiple bodies. See the Averaged vs. Unaveraged Contour Results section of the Help for additional information.
|
|
|