


Go to a section topic:
Overview
Normally, contour results in the Mechanical application are displayed as averaged results. Some results can also display as unaveraged contours. Averaged contours distribute the average elemental nodal results across element and geometric discontinuities. A user option exists that allows you to control whether results are also averaged across body boundaries that contain a conformal mesh. The default setting does not calculate an average across bodies.
Using the Mechanical APDL application terminology, unaveraged contour results display as element nodal contours that vary discontinuously even across element boundaries. These contours are determined by linear interpolation within each element and are unaffected by surrounding elements (that is, no nodal averaging is performed). The discontinuity between contours of adjacent elements is an indication of the gradient across elements.
Results that include the unaveraged contour display option are elemental-nodal quantities such as stress or strain. This option is not available for degree of freedom results such as displacements.
Nodal averaging of element quantities involves direct averaging of values at corner nodes. For higher-order elements, midside node results are then taken as the average of the corner nodes.
In Mechanical, there are two distinct techniques for calculating averaged principal nodal results. The calculation for the first technique is as follows (using stress as the result in question):
Average the component (X, Y, Z, XY, YZ, XZ) stress values from the elements at a common node.
Calculate the principal stresses from the averaged component values
The calculation for the second technique is as follows:
Calculate the principal stress values (from the six component strains) on a per element basis.
Average these values from the elements at a common node.
For principal tensor results excluding equivalent strain, the first technique is normally used to calculate the results. For equivalent stress, stress/strain intensity, max shear stress/strain, and principal stresses/strains, the first technique is used to calculate the results. For equivalent strains, which are calculated by the Mechanical APDL solver, the second technique is used. For random vibration analysis, equivalent stresses are calculated by the Mechanical APDL solver using the Segalman method, so the second technique is also used. See the Average Across Bodies: Using the Feature topic below for additional discussions. Also see the AVPRIN command in the Mechanical APDL Commands Reference.
Note: If an elemental result is scoped to a surface body, then there may be two sets of results at each node (Top and Bottom) and sometimes a third set of results (Middle). At release 12.0, if the solver writes Middle results to the result file, then Mechanical displays these results if the Shell Face setting in the Details view equals Middle (Membrane). If the solver did not write Middle results to the result file, then Mechanical displays the average of Top and Bottom if the Shell Face setting in the Details View is Middle (Membrane). For a given node on the shell, the application will average Top results, separately average Bottom results, and separately average Middle results. When you export a result in the application that is set to Top/Bottom, you may note that a node number is repeated in the Excel file. This is because both the Top and Bottom stresses are listed.
Beginning at Release 16.0, Mechanical supports the // positions for layered solid bodies. Therefore, layered solid elements mimic expanded shell elements, which display as having a thickness between the face and face.
Display Option
The Display Option property enables you to display contour results as:
Unaveraged: Displays unaveraged results.
Averaged (default): Displays averaged results.
Nodal Difference: Computes the maximum difference between the unaveraged computed result (for example, total heat flux, equivalent stress) for all elements that share a particular node.
Nodal Fraction: Computes the ratio of the nodal difference and the nodal average.
Elemental Difference: Computes the maximum difference between the unaveraged computed result (for example, total heat flux, equivalent stress) for all nodes in an element, including midside nodes.
Elemental Fraction: Computes the ratio of the elemental difference and the elemental average.
Elemental Mean: Computes the elemental average from the averaged component results.
Caution: Although you can select the above options, certain result types do not support them. For example, the application will generate a Warning if you specify or for elemental results, such as , and the result will not be evaluated. This is also true if you select , , and for nodal results, such as displacement.
Note: For result displays on shells, when the Display Option property is set to and the Position property is set to , the mean value will include values from both the top and bottom of the shell. You can view the Elemental Mean for either the top or bottom of the shell by using the Position property setting or .
Characteristics of unaveraged contour displays:
Because of the added data involved in the processing of unaveraged contour results, these results take a longer time to display than averaged results.
Occasionally, unaveraged contour result displays tend to resemble a checkerboard pattern.
Capped Isosurface displays can have missing facets.
Average Across Bodies: Using the Feature
When you select Averaged as the Display Option, the Average Across Bodies property displays in the Integration Point Results category. Setting this property to (the default value is ) enables you to average the result across the separate bodies on your model. This post-processing feature is supported for most averaged element nodal contour results (like stress, strain, and thermal flux).
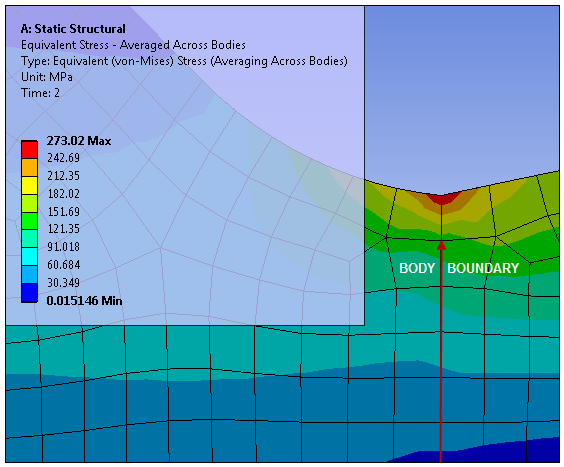
For example, for a node shared between two bodies, the average stress contributed to it by each body is typically different. Using the Average Across Bodies feature, the average stress value for this node will be the average of the stress values from all "scoped" elements (elements that contain this node) from both bodies. This enables you to display a smoother result contour at the interface of the bodies that share a node. If bodies do not share nodes, then the feature has no effect.
Calculation Condition Notes
Note the following requirements for averaging results across bodies.
A principal value is averaged when Mechanical averages results across bodies for principal and vector sums. Calculated results, such as the types listed below, are averaged according to the following definitions:
1) Tensor or vector components (corresponding to X,Y,Z,YZ,YZ,XZ) at the node in question are averaged within each body connected to that node, and, 2) A principal value, such as S1 or SEQV or TFSUM, is calculated at the node in question for each body connected to that node, and, 3) A weighted average is calculated from these principal values. This is different than the usual method (except for Equivalent Strain) where components are averaged and then the principal value is computed. Example Averaged Result Types
Principal Stresses (1, 2, 3)
Stress Intensity (INT)
Equivalent Stress (EQV)
Principal Strains (1, 2, 3)
Strain Intensity (INT)
Equivalent Strain (EQV)
Total Thermal Flux
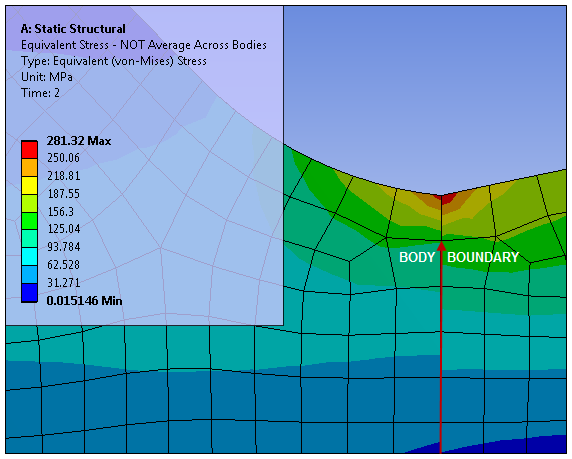
The following result illustrations illustrate the outcomes between not performing an average calculation, performing an average calculation that is not across bodies, and performing an average calculation that is across bodies.
No Averaging No Averaging Across Bodies Averaging Across Bodies 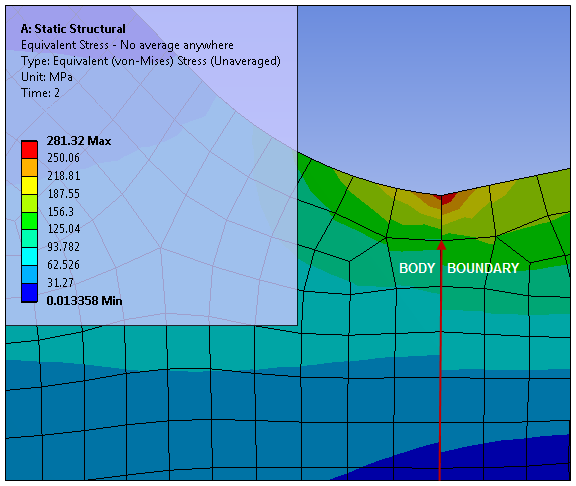
If the associated bodies have different material properties, such as Poisson's ratios, then, because this feature averages quantities like equivalent elastic strain at common nodes, you may see unexpected results at the interfaces. The Poisson Ratio employed to calculate elastic equivalent in one body may be significantly different from the Poisson Ratio employed to calculate elastic equivalent in a different body. Therefore, in this scenario, averaging across bodies at the interface is not recommended.
If you choose to compare this feature against Mechanical APDL PowerGraphics with AVRES,1,FULL in effect, PowerGraphics employs the effective Poisson's ratio in the AVPRIN,KEY,EFFNU command. The EFFNU value may not match the Poisson's ratios in all bodies. PowerGraphics also calculates equivalent strain from the average component strains if KEY (in the AVPRIN command) is set to ZERO. As a result, there may be differences between this feature and PowerGraphics when the AVRES,1,FULL command is employed.
Support Limitations
The following results features are not supported:
Probe results
Results in cyclic symmetry analyses
Results on line bodies
Body Type Calculations
If the scoping of your result includes both solid and surface bodies, the application will average across the solid body first and then performs a separate averaging across the surface body. These results are averaged separately because surface body elements element includes bottom and top results for each node on the top/bottom surface. The solid body element has only one result at a node (as there is no bottom/top).
Averaging Element Nodal Results
For most element nodal results (like stresses and strains), the Mechanical solvers write only the unaveraged corner node values to the result file. No element nodal results are written for mid-side nodes. This difference is of critical importance.
To derive the value at a mid-side node, the Mechanical post processor must employ the values at the corner nodes. There are three distinct techniques for this process:
For line elements, such as unexpanded beam and pipe stress, Mechanical calculates the average of the unaveraged values of those corner nodes which share an edge with the mid-side node - corner nodes, node I and node J. See Case 1 below.
For solid elements (i.e. shell, hexahedron, tetrahedron, wedge, and pyramid elements), the technique calculates the mid-side node results from the averaged corner nodes. See Case 2 below.
For contact elements, the technique calculates the mid-side node results by averaging the un-averaged values of adjacent corner nodes. Note: A result max may be at a mid-side node. See Case 3 below.
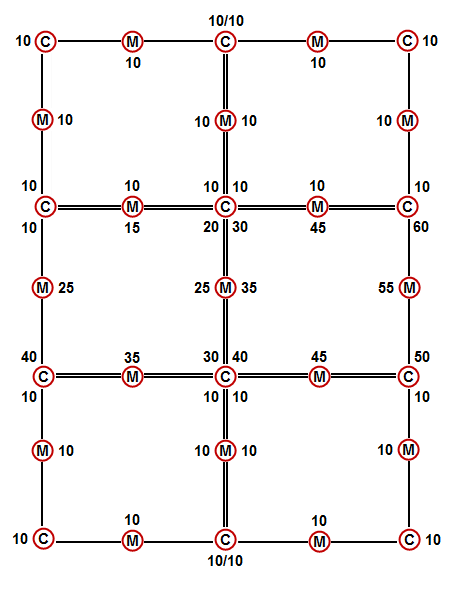
Corner Node Calculation Case 1
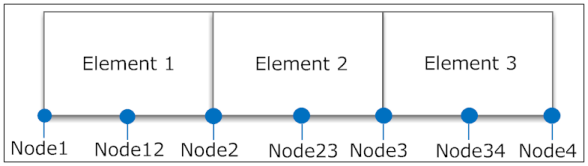
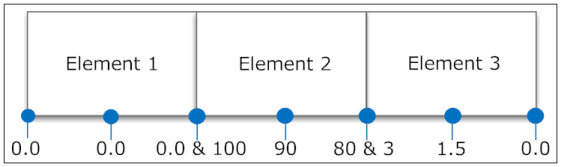
Consider the following example consisting solely of high order line elements, where:
Element 1 contains nodes 1, 2, and 12.
Element 2 contains nodes 2, 3, and 23.
Element 3 contains nodes 3, 4, and 34.
Nodes 12, 23, and 34 are mid-side nodes.
If:
The element nodal solution for element 1 is 0.0 and 0.0 for nodes 1 and 2.
The element nodal solution for element 2 is 100 and 80 for nodes 2 and 3.
The element nodal solution for element 3 is 3 and 0.0 for nodes 3 and 4.
The unaveraged solution is then:
The value at node 12 is the average of the values at the associated element's end points, namely 0.0.
The value at node 23 is the average of the values at the associated element's end points, namely 90.
The value at node 34 is the average of the values at the associated element's end points, namely 1.5.
For the averaged solution of nodes 2 and 3:
The value at node 2 is 50.
The value at node 3 is 41.5.
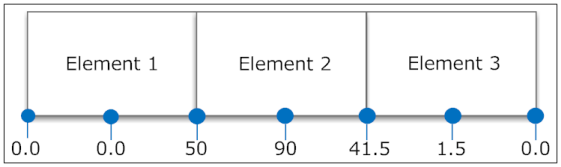
Note that the value at the mid-side node 23 (90) exceeds the values at the end points.
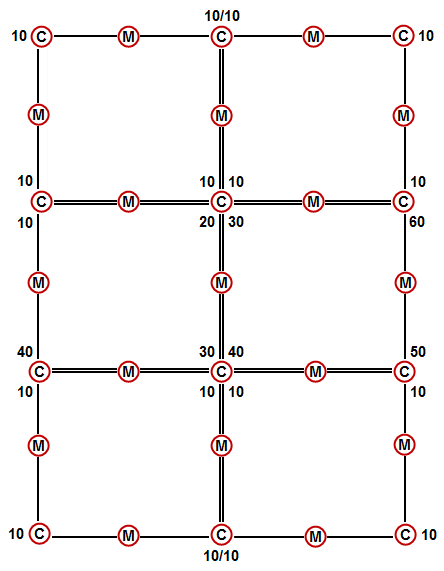
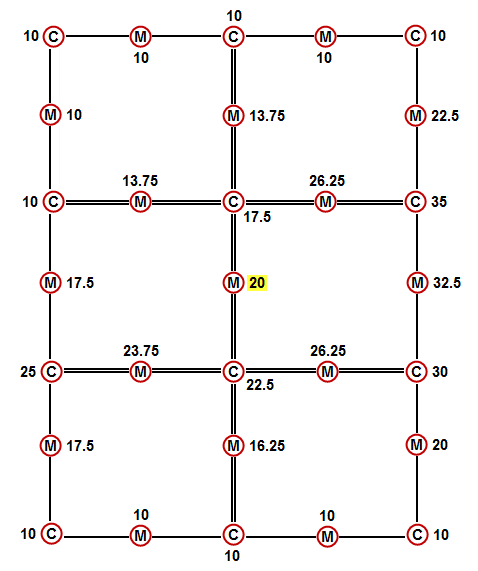
Corner Node Calculation Case 2
Result averaging for solids: mid-side node results are the average of the averaged corner node values.
| Raw Data | Averaged Corner Nodes |
|
|
|
| Mid-Side Nodes Calculated from Averaged Corner Nodes | |
|
| |
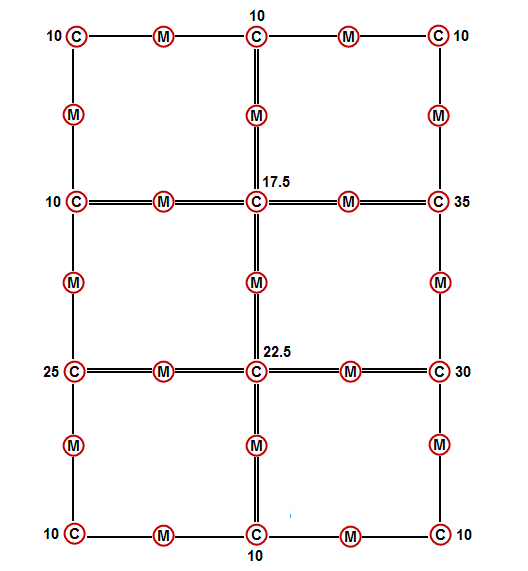
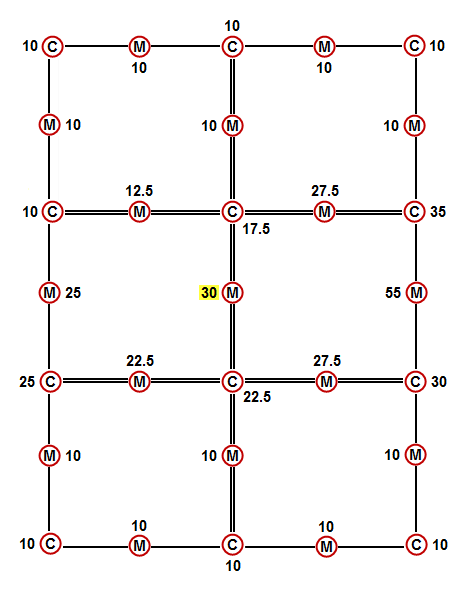
Corner Node Calculation Case 3
Result averaging for contacts: calculate the final mid-side node results by averaging intermediate mid-side values.
| Raw Data | Averaged Corner Nodes |
|
|
|
| Mid-Side Nodes Calculated from Averaged Corner Nodes | |
|
| |
Note: Result maximum in this case may be at a mid-side node.