


During LS-DYNA analyses, plot a two-dimensional graph in the X and Y directions, for supported input data. Once you specify your data, you can then apply an operation or filter to your graph.
Object Properties
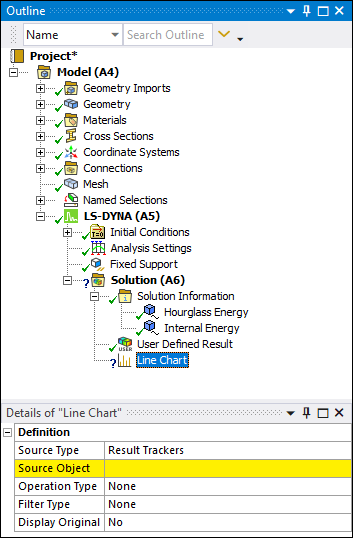
The Details Pane for this object includes the following properties.
| Category | Properties/Options/Descriptions |
|---|---|
|
Definition |
Source Type: Options include and . Source Object: Based on your selection for the above property, use this property to select one or more objects you wish to chart (result tracker or line chart objects) or to open a dialog to select a desired file. Input Unit System: Read-only property displaying the supported unit system. Operation Type[a]: Specify a desired operation to perform on your dataset. Options include:
Filter Type[a]: Specify a desired filter to apply to your dataset. Options include:
Cutoff Frequency: This property displays when you select one of the above filters. It defines a cutoff frequency value for the applied filter. Cutoff Frequency Limit: This property displays when you select one of the above filters. It is a read-only property that displays the cutoff frequency limit for the current dataset. The limit indicates the maximum value for the cutoff frequency that can still support filtering. This value helps you fine tune your Cutoff Frequency property entry. Display Original: Options include (default) and . |
[a] You cannot use the options of the Operation Type property and the Filter Type property in combination. Specifying an Option Type automatically causes the Filter Type property to be set to , and vice versa. In addition, these properties are only supported for objects or files that include one dataset.
Tree Dependencies
Valid Parent Tree Object: Solution.
Valid Child Tree Objects: No supported child objects.
Insertion Methods
To add a Line Chart object, highlight the object and either:
Select the Line Chart option from the Solution Context Tab.
Right-click and select > Line Chart.
You can also right-click within the Geometry window and select > Line Chart.
Right-click Options
In addition to common right-click options, relevant right-click options for this object include:
Additional Related Information
Also see the Line Chart Results (LS-DYNA Only) section for the steps to create and define this object.