


Line Integral Convolution (LIC) is a technique of using a flow field to blur or smear (convolve) a texture image mapped to a surface in the flow domain to provide a visual representation of the vector field on that surface. This results in an effect that is similar to a static picture of the flow field for moving smoke or fluid injected into the fluid. Generally, the integration is done using the flow velocity field, but you can use any other vector field.
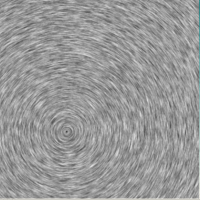
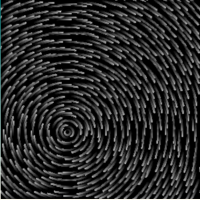
There are two different types of LIC visualizations supported in Fluent; Standard LIC and Oriented LIC. Oriented LIC plots are beta at 2024 R2, while Standard LIC are full feature. The general methodology is the same for both types, but each uses different initial textures, on which the integration and convolution is performed. This results in very different visualization effects for the vector field, as shown in Table 21.1: Standard LIC (left) and Oriented LIC (right).
(Full feature) Standard LIC uses an isotropic convolution and has a dense texture that is analogous to higher concentrations of smoke in the flow. It can show flow lines but not the specific orientation. Left to right flow will look the same as right to left flow. It can still be useful when the flow direction can easily be determined by geometric context.
(Beta) Oriented LIC uses an anisotropic convolution and a more sparse texture. This gives a result that shows both the flow direction and orientation and is similar to traditional short-length streamline or pathline visualizations.
Note: Before creating an LIC plot, you must create a plane surface for the LIC plot. Refer to Plane Surfaces in the Fluent User's Guide for additional information on creating plane surfaces.
To create an OLIC plot:
Right-click OLICs in the Outline View tree and select New....
 Results → Graphics
→ OLICs
Results → Graphics
→ OLICs New...
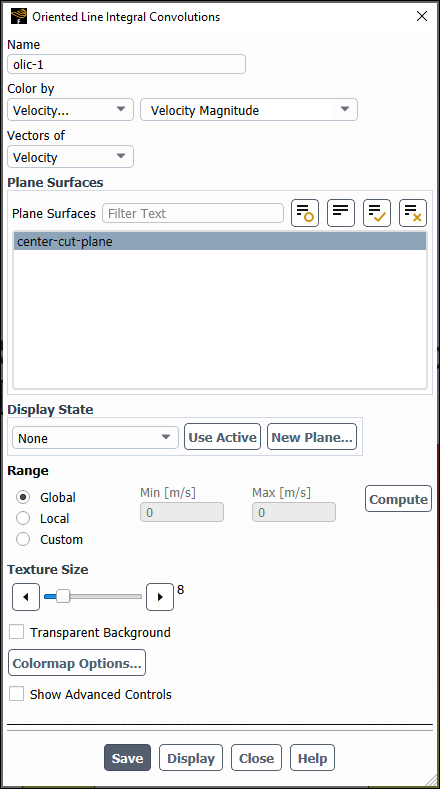
 (Optional) Enter a Name for the OLIC object.
Specify the field variable you want to use to color the OLIC results by selecting the category and variable from the Color by drop-down lists.
(Multiphase only) Specify the Phase.
Specify whether the vectors represent velocity or relative velocity using the Vectors of drop-down list.
Select the planar surface(s) where you want the OLIC results displayed in the Plane Surfaces list.
You can click to open the Plane Surface Dialog Box in the Fluent User's Guide.
(Optional) Specify the display state that you want associated with this object. Refer to Controlling the Display State and Modifying the View in the Fluent User's Guide for additional information.
Specify whether you want the range to be Global, Local to the selected surface(s), or Custom.
Set the Texture Size slider to control the size (in 100's of pixels) of the texture image used in the convolution.
(Optional) Enable Transparent Background to display the convolutions with a transparent background instead of the default black background.
Click .
Click if you are happy with the plot and want it to persist with the case file.
Advanced Controls
Additional OLIC controls are available for modification but are hidden by default. Enable Show Advanced Controls to see these additional controls:
Use the Intensity Factor to scale the intensity levels of the convolution results up or down. You can use this to control the brightness or contrast of the resulting image.
Specify the maximum number of integration steps performed during the convolution. The Maximum Number of Steps value is used independently for both the forward and backward integration, so the total number of steps for each convolution calculation can be double the number specified.
Set the Seed Spacing to control the density of the texture seed points. The number specified is the general number of pixels separating the placement of the seed points prior to integration. The actual displayed density will be controlled by both this field and the Texture Size field.
The Line Integral Convolution dialog box allows you to create a line integral convolutions (LIC) plot.
Controls
- Name
designates the name of the LICs plot.
- Color by
drop-down lists for the category and field variable used to color the plot.
- Phase
(Multiphase only) specifies the phase that the colors apply to.
- Vectors of
contains a list from which you can select the vector field to be plotted.
- Phase
(Multiphase only) specifies the phase for the velocity or relative velocity vectors.
- Plane Surfaces
list of planar surfaces available for displaying the LICs plot.
- Display State
specifies the display state that is associated with this graphics object.
- drop-down list of display states
selectable list of all the existing display states associated with this case.
creates a display state that matches the settings of the active graphics window and assigns it to this graphics object (this association is only saved after you click ).
- New Plane...
opens the Plane Surface Dialog Box in the Fluent User's Guide.
- Auto Range
toggles between automatic and manual setting of the range for the variable coloring the LICs.
computes the minimum and maximum values of the field variable coloring the LICs.
- Texture Size
controls the size (in 100's of pixels) of the texture image used in the convolution.
- Colormap Options...
opens the Colormap Dialog Box in the Fluent User's Guide, allowing you to customize the colormap for this graphics object.
- Transparent Background
makes the background of the plotted surface transparent instead of the default black coloring.
- Show Advanced Options
exposes additional advanced controls.
- Intensity Factor
scales the intensity levels of the convolution results up or down. You can use this to control the brightness or contrast of the resulting image.
- Maximum Number of Steps
the maximum number of integration steps performed during the convolution. The Maximum Number of Steps value is used independently for both the forward and backward integration, so the total number of steps for each convolution calculation can be double the number specified.
- Seed Spacing
controls the density of the texture seed points. The number specified is the general number of pixels separating the placement of the seed points prior to integration. The actual displayed density will be controlled by both this field and the Texture Size field.
saves the settings of the plot as they currently appear in the dialog box.
displays a plot with the settings shown in the dialog box. Note that this button does not save the settings, so if you modify settings and display the updated plot, you must click to preserve these settings before closing the dialog box.