Transient postprocessing in Fluent allows you to analyze results after Fluent is done running. You can investigate values of monitors that were not captured during the run and create animations of the solution evolution. Additionally, you can compare contours from different time steps and generate a difference plot.
Transient postprocessing gives you the flexibility to capture data that was not gathered when the data files were originally generated. For example, you forgot to define a monitor or create an animation definition prior to running the solver.
Accessing the Feature:
Enable Transient Postprocessing (beta) in the Appearance branch of Preferences (File > Preferences...).
Read in the last data file of the dataset you are analyzing.
Important: Transient postprocessing is not for looking at individual results. If that is your intent, load the data file of the desired time step last, and it will be available for postprocessing.
The features of Transient Postprocessing are described below.
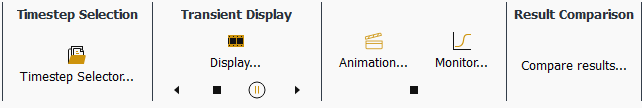
Controls
- Timestep Selector
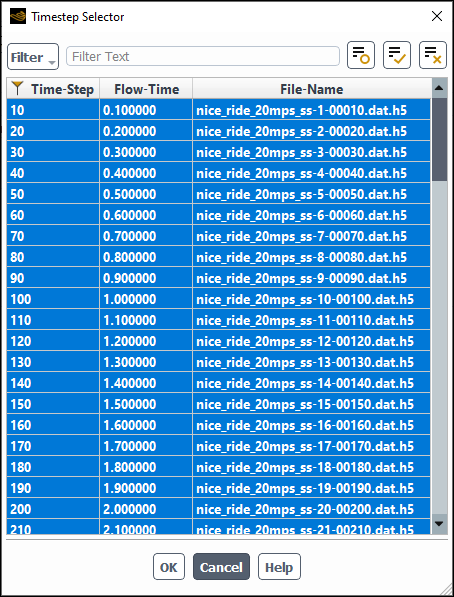
Controls which data are included for the creation of the transit postprocessing operations –report plots and animations. It is not for selecting an individual timestep to interrogate. Regardless of which timestep(s) is selected in the Timestep Selector, when you evaluate an individual post object (report, contour, and so on) the values shown are for the final timestep.
- Transient Display
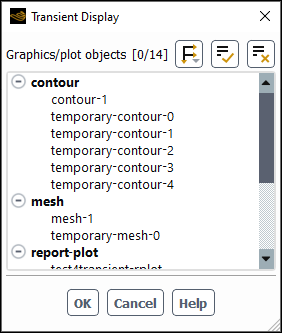
Creates the equivalent to an animation that is not stored. It shows the progression of the selected item(s) as the data (specified in the Timestep Selector) is read and the plot objects displayed.
All graphics objects (mesh, contours, vectors, pathlines, scenes) are displayed in the same window. The playback of the transient display is controlled via the Reverse, Stop, Pause, and Play buttons. Stop resets the sequence to start at the first selected timestep.
Important: If you want to save animations or plot data for future re-use, you must use the Animation… and Monitor… functions in the ribbon.
- Animation...
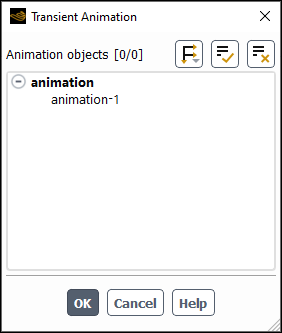
Allows you to create animations of contours, vectors, pathlines, and plots, based on the data selected in the Timestep Selector.
- Monitor...
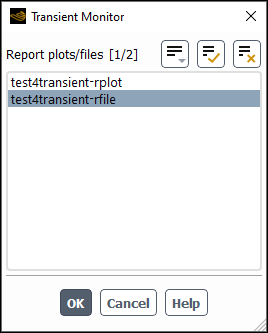
Allows you to create report plots and files based on the data selected in the Timestep Selector.
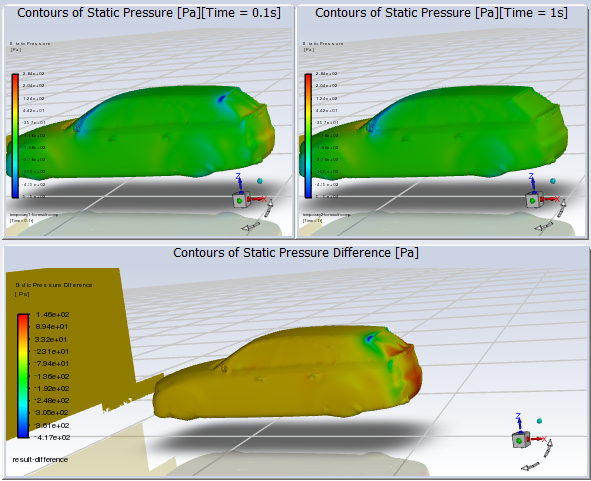
- Compare Results...
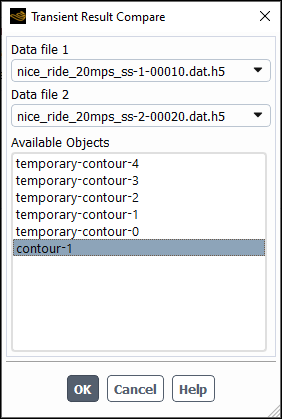
Allows you to select 2 timesteps and compare the contour plots. This shows the 2 contour plots side by side along with a plot showing the differences.
Specify which data you want included in the animation using the Timestep Selector.
Create the type of postprocessing object that you want animated. Report Definition (and requisite Report File and Report Plot), Contour, Vector, Pathline, Scene, XY Plot are supported.
Create an animation definition for each object you want animated.
Click Animation… in the ribbon, select the desired Animation Objects, and click .
Create a report definition (and corresponding Report File and Report Plot) for each desired quantity. Refer to Monitoring and Reporting Solution Data in the Fluent User's Guide for additional information on report definitions.
Click , select the report files you want written, and click .
Important: If you only select a report plot, you will see the evolution of the plot as Fluent displays the value at each timestep (the same as selecting a report plot for transient display), however, nothing will be written to a file. To write the data behind a report plot to a file you must select a report file (or create one) containing the desired report definition.
Note: you can click to stop Fluent from writing more files or plots.