Selecting a Far-Field Quantity to Plot
When plotting far-field quantities, the quantity can be a value that was calculated by HFSS such as antenna gain, a value from a calculated expression, or an intrinsic (inherent) variable value such as frequency or theta.
Prerequisites
For the Far Field Report icons to appear on the ribbon, or for the Create Far Field Reports command to appear on the Results menus, the design must contain radiation boundaries, PMLs or Hybrid regions, and must contain a Far Field Setup.

To tune Far Field plots based on partial quantities, the design must include a variable from which derivatives can be calculated. See: Derivative Tuning for Reports.
To plot a far-field quantity:
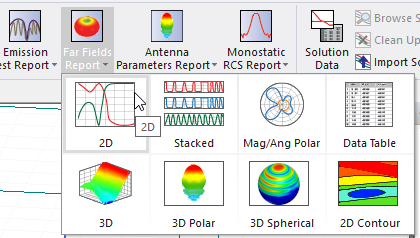
- From the Results ribbon, select the Far Fields Report icon, or select Results > Create Far Fields Report to open the Report window.

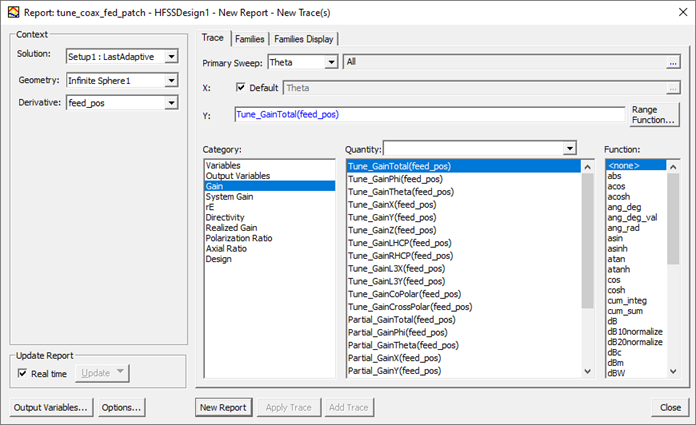
If your design includes one or more variables for derivatives, you can select one or all derivatives. Selecting a Category will list tunable Quantities available:

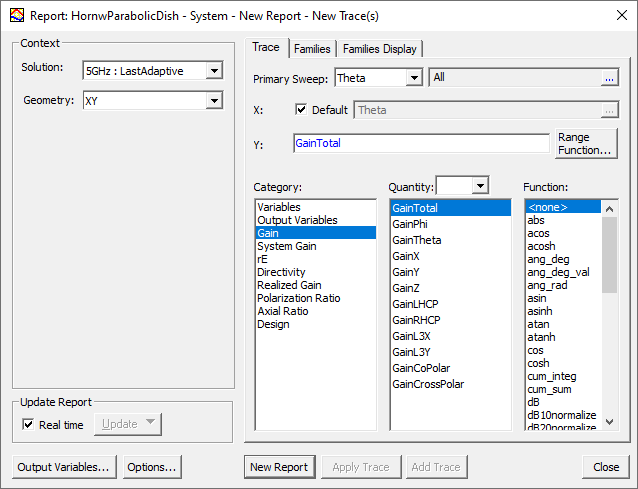
- In the Context area, select the Solution, Geometry, and Source. Note:
In the case of finite array, select a Source group.
- Make a selection from the Category list. The available options may differ depending on previous choices. Selecting one or more Derivatives results in Tunable variations of these quantities being listed:
Variables
Intrinsic variables, such as frequency or theta, or user-defined project variables, such as the length of a quarter-wave transformer.
Output Variables
User-defined expressions applied to derive quantities from the original field solution.
Gain Gain is 4π times the ratio of an antenna's radiation intensity in a given direction to the total power accepted by the antenna. System Gain System gain appears in the Quantity list if Edit Sources was used to specify system power for gain calculations. System gain is 4π times the ratio of an antenna's radiation intensity in a given direction to the user-specified power. rE
The selected component of the radiated electric field, which is multiplied by the radial distance, r.
Directivity
Directivity of the antenna.
Realized Gain
Realized gain is 4π times the ratio of an antenna's radiation intensity in a given direction to the total power incident upon the antenna port(s).
Polarization Ratio
Polarization ratio of the electric field.
Axial Ratio Axial ratio of the electric field. Normalized Bistatic RCS
The normalized radar cross-section:

where λ0is the wavelength of free space.
RCS is supported for designs with Plane Incident Waves. RCS is not supported for other types of incident waves.
Radar Cross-Section (Bistatic RCS)
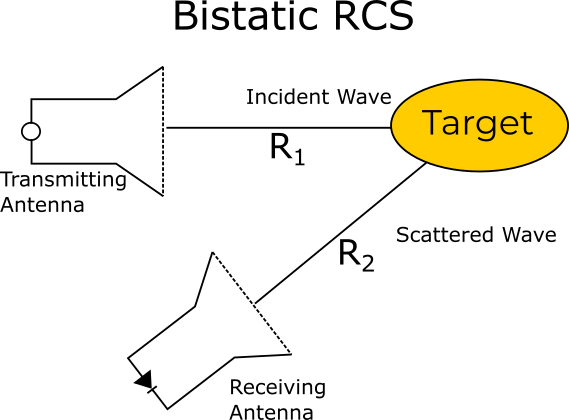
The radar cross-section (RCS) or echo area (σ) is measured in meters squared and represented for a bistatic arrangement (e.g., when the transmitter and receiver are in different locations as shown in the figure below). This is represented by:

where:
- Escat is the scattered E-field.
- Einc is the incident E-field.
RCS is supported for designs with Plane Incident Waves. RCS is not supported for other types of incident waves.
Complex (Bistatic) RCS
The equation for complex (bistatic) RCS is calculated as:

where:
- Escat is the scattered E-field.
- Einc is the incident E-field.
This form retains the phase information.
RCS is supported for designs with Plane Incident Waves. RCS is not supported for other types of incident waves.
Monostatic RCS
The radar cross-section (RCS) or echo area when the transmitter and receiver are at the same location.
For Monostatic RCS, you need not be concerned with the Theta and Phi values defined in the radiation sphere. Only the incident wave Theta and incident wave Phi are used in calculating a Monostatic RCS plot.
RCS is supported for designs with Plane Incident Waves. RCS is not supported for other types of incident waves.
A proper incident angle sweep should exist at the incident wave source setup before HFSS can plot Monostatic RCS
The following diagram shows the bistatic RCS concept, with separate transmitting and receiving antennas.

Each Category item selected updates the Quantity list to offer quantities appropriate to selected category. Category selection for a Variable of an Output Variable lists those available in each case. Selecting Antenna Parameters as Category causes the Quantity list to show Antenna parameters. The selected Category provides the default report name, such as rE Plot n.
- Select the Quantity to apply to the selected Category.
If the Category item is rE, Gain, Directivity, or Realized Gain, you will need to specify the polarization of the electric field by selecting from the Quantity list. If you manually enter Phi or Theta component of a far field quantity when using Az/El or El/Az far field definition, the Report uses the Z axis of the Az/El or El/Az coordinate system definition as pole to calculate theta/phi component for rE.
Total
The combined magnitude of the electric field components.
Phi
The phi component (φ).
Theta
The theta component (θ).
X
The x component.
Y
The y component.
Z
The z component.
LHCP
The dominant component for a left-hand, circularly polarized field.
RHCP
The dominant component for a right-hand, circularly polarized field.
CircularLHCP
The polarization ratio for a predominantly left-hand, circularly polarized antenna.
CircularRHCP
The polarization ratio for a predominantly right-hand, circularly polarized antenna.
SphericalPhi
The polarization ratio for a predominantly φ-polarized antenna.
SphericalTheta
The polarization ratio for a predominantly θ-polarized antenna.
L3X
The dominant component for an x-polarized aperture using Ludwig's third definition of cross polarization.
L3Y
The dominant component for a y-polarized aperture using Ludwig's third definition of cross polarization.
CoPolar Reports fixed polarization rotated around Z axis by “slant” angle from X axis of coordinate system of Infinite sphere definition:

where a is the slanted angle.
CrossPolar 
where a is the slanted angle.
The plot's Y axis field shows the combined selections.
For example, if you select Gain as the Category and RHCP as the Quantity, HFSS evaluates the equation as:


- You can also
select a function to apply to the your selections for the
Category and Quantity (e.g., mag).
As you make selections for Category, Quantity, and Function, the Y field shows the combined calculation they describe.
- When you are finished, click New Report to create the report.
The new report based on your selections is displayed.
