
Selecting Antenna Parameters to Plot
Complete these steps to select and plot antenna parameters.
- When you create the report, select Antenna Parameters, using either Results>Create Antenna Parameters Report><reportType>, or using the ribbon:
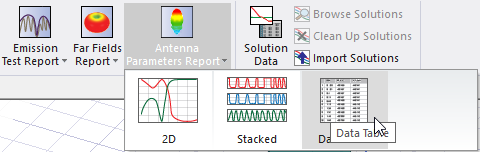
The format can be Data Table, Rectangular Plot, or Rectangular Stacked Plot, but because each trace includes a single quantity, you may prefer Data Table as the most appropriate display.
- In the Report dialog box, select Antenna Params as the Category and apply an appropriate Quantity from the list. HFSS-calculated quantities that include peak directivity, peak gain, peak realized gain, beam area*, radiated power, accepted power, radiation efficiency including the total and component values at Phi and Theta, max U, and array factors. For descriptions of CoPolar and Cross Polar, see the table in Step 4 of Selecting a Far Field Quanity to Plot. For far-field setups, the decay factor for lossy materials is calculated as a constant for all far fields. *Beam area is the calculated as the beam solid angle. In its simplest form it is = 4*pi/D; where D is the max directivity.
- If appropriate, select one or more options from the Function list.
- Make any other selections, as necessary.
- Click New Report.
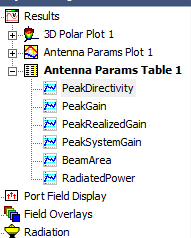
- If necessary, return to the Report window to select additional options from the Quantity and Function lists. Then click Add Trace. Each additional trace appears in the report and in the Project Tree.
| PeakDirectivity | DecayFactor | MaxrEZCompAtTheta | MaxrELudwig3XComp |
| PeakGain | FrontToBackRatio | MaxrEThetaComp | MaxrELudwig3XCompAtPhi |
| PeakRealizedGain | MaxrETotal | MaxrEThetaCompAtPhi | MaxrELudwig3XCompAtTheta |
| PeakSystemGain | MaxrETotalAtPhi | MaxrEThetaCompAtTheta | MaxrELudwig3YComp |
| BeamArea | MaxrETotalAtTheta | MaxrEPhiComp | MaxrELudwig3YCompAtPhi |
| RadiatedPower | MaxrEXComp | MaxrEPhiCompAtPhi | MaxrELudwig3YCompAtTheta |
| AcceptedPower | MaxrEXCompAtPhi | MaxrEPhiCompAtTheta | MaxErCoPolar |
| IncidentPower | MaxrEXCompAtTheta | MaxrELHCPComp | MaxErCoPolarAtPhi |
| RadiationEfficiency | MaxrEYComp | MaxrELHCPCompAtPhi | MaxErCoPolarAtTheta |
| TotalEfficiency | MaxrEYCompAtPhi | MaxrELHCPCompAtTheta | MaxErCrossPolar |
| SystemEfficiency | MaxrEYCompAtTheta | MaxrERHCPComp | MaxErCrossPolarAtPhi |
| MaxU | MaxrEZComp | MaxrERHCPCompAtPhi | MaxErCrossPolarAtTheta |
| ArrayFactor | MaxrEZCompAtPhi | MaxrERHCPCompAtTheta |
- Click OK to accept the specified values or Cancel, Use Defaults, or Save As Default as appropriate.