Derivative Tuning for Reports
The Derivative Tuning feature available in the results menu is based on the derivatives that you can request for selected variables in the solution setup. It is limited to quantities like S-parameters and Far Fields, where far-field tuning supports the following:
- Incident Wave
- Linked Field
- Voltage Source
- Current Source
- Magnetic Bias : Note: Sensitivity analysis of a design variable associated with the magnetic bias region assumes that the magnetic bias field does not change. In some cases this assumption may not be appropriate and requires user discretion to ensure its applicability especially for non-uniform ferrite models.
Tuning far field quantities determines the derivatives of the response of electromagnetic devices with respect to variations in geometric or material properties. Designs can include port excitations or non-port excitations (that is, incident waves, linked field, voltage source and current source.
Note: Sensitivity analysis of a design variable associated with the magnetic bias region assumes that the magnetic bias field does not change. In some cases this assumption may not be appropriate and requires user discretion to ensure its applicability especially for non-uniform ferrite models.
Results obtained by the “Tune Reports” functionality is only an estimate, it is recommended that designs be re-analyzed with the variables values changed to include any tuning offsets to get an accurate result.
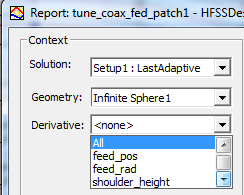
Frequencies, and local quantities cannot be tuned. If you have defined variables in the solution setup, the Context area of the Reporter displays the Derivative field, from which you can select the variable(s) for a tunable report.

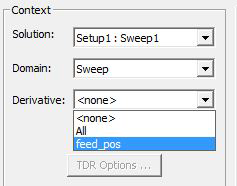
A common way to use this feature is to produce, for an output quantity of interest, two curves in one plot. One curve is produced with the Report dialog selection for the Context Derivative as <none>. The other has the All or specific variable selection.

When you select All or a variable, notice that the Context field of the Report dialog shows the names of various parameters prefixed with Tune. Some of the Quantities associated with the category also show a Tune prefix. This labeling makes it easier to distinguish the Tuned traces from the reference traces.

In the case of a Far Fields plot, the Tune prefix appears in only in the Quantity field.

This gives you a plot with initially two identical curves, one on top of the other. The curve info table shows the trace names. This example shows the curve info for a plot with a normal S-parameter trace with a TuneS trace that can be tuned using the value of the $radius variable.

This example shows the curve info for a plot with a normal rETotal trace with a Tune_rETotal trace that can be tuned using the value of the $radius variable.

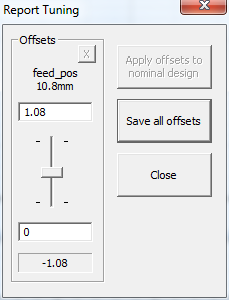
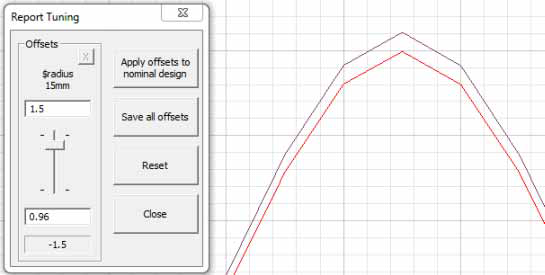
You can then right-click Results in the Project tree and select Tune Reports. The Report Tuning window appears. You can use the slider to tune the Tune curve interactively while the reference curve stays to provide a reference. This way you can see interactively how small changes in variables affect the result. You can then apply those offsets to the original variable values and re-solve the design.

The overall procedure for Report Tuning follows.
- Generate a solution with one or more variables for which you select Use on the Derivatives tab of the solution setup.
- Use the Reporter to create one curve with Derivative selection in the Context panel of the report dialog set to None.
- Then create another curve, but in the Context pane. select for Derivatives, All or the variable of interest. Select to build your new trace from the Categories and Tune Quantities listed.
This gives you two identical curves, one top of the other. Notice that you are not limited in the number of traces that you define. You may choose to limit the number of traces for more ease in observing the results of tuning.
- Click the HFSS>Results>Tune Reports or right-click Results in the Project tree and click Tune Reports from the short cut menu. The menu item is disabled if no variables have been selected in the Derivatives tab of the solution setup.
This displays a Report Tuning dialog which lists the variables available for tuning. The example above shows a Report Tuning dialog for a design with only one variable but it can show more.
- You can use the slider to adjust the value of each available Tune variable. When you move a slider, the Apply offsets to nominal design button and the Save all offsets buttons are enabled. The Report shows the change to all Tune traces, relative to any reference traces you define.

The Tune dialog displays the change to the variable selected. For example, if the variable is $length with a value of 1mm, and the slider shows 0.1mm, then the effective value of $length for the purpose of derivatives is 1.1mm. If you exit the dialog by applying the offset or offsets (click Apply offsets to nominal design), $length is assigned a value of 1.1mm. You can then re-solve, and get results based on the derivative's prediction.
- Close lets you close the dialog.
