
Viewing Analysis Result for Design of Experiments
After the Analysis has competed, you can right-click the Design of Experiments setup in the Project tree and click View Analysis Result on the shortcut menu. This opens a dialog that includes a Result tab that lists the variations and variable values, a solution Profile tab with start, stop, time elapsed, and machines used, as well as a Response Surface tab. When you include more than one variable in the setup, response surface view is available. You can choose any two variables as the X, Y axis, and choose an output calculation as the Z axis, by clicking the ellipsis [...] button next to the view list box.
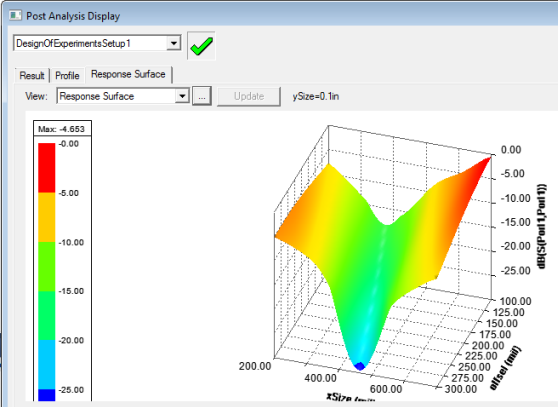
From the Response Surface tab, the “View” list box lets you select all available views of the selected response-surface-setup.
- Min Max Search
- Refinement points table
- Response points table
- Verification points table
- Goodness of Fit
- Response Curve
- Response Curve (2D Slices)
- Response Surface
- Local Sensitivity Charts
- Local Sensitivity Curves
The Update push button is disabled when the response surface is up to date. After the setup, if you modify a verification point or refinement points, it is enabled. Click this button to re-generate the response-surface with new settings. It may start new simulations if any of the design points in the DOE, refinement points, or verification points has not been solved.
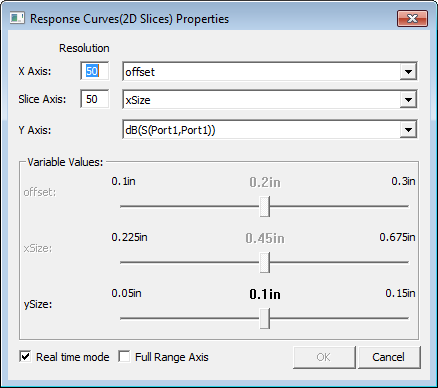
Clicking the ellipsis button [...] by the View for Response Surface opens a dialog that lets you adjust the variables selected and the values applied.
Tuning a Response Curve
For the X Axis and Y Axis, you can specify a Resolution, and the variable to use. For the Z Axis you can select the Cost or calculation. For variables not selected for the X and Y axis, a slider is enabled that lets you adjust the value to see the effect on the response curve plot. You can enable or disable Real time mode by using the check box at the lower left.
Full Range Axis check box
When it is checked all Axes are set to their maximum ranges, and the ranges won’t be changed while tuning unless you change the axis variable.
When it is unchecked, the Y(2D)/Z(3D) axis range is auto updated to fit the curve/surface.
Exporting Response Curve Data
You can Export the response curve data as a table in the following formats:
- Comma delimited data files, (*.csv)
- Tab delimited data files, (*.tab)
- Ansys Plot data files, (*.dat)
- Post Processor format data files, (*.txt)
- Ansys Report Data *.rdat files
Exported files can be imported into a report.