Local Sensitivity Curves
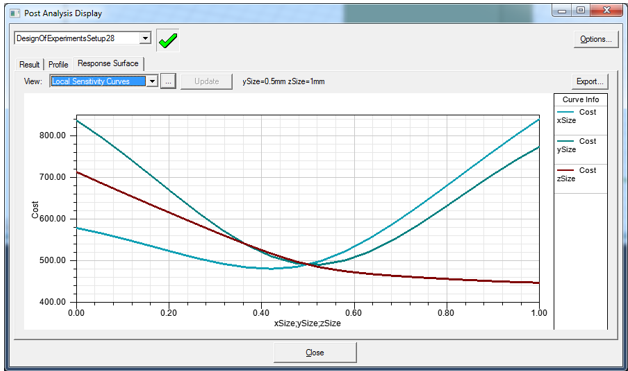
From the Response Surface tab, the “View” list box lets you select all available views of the selected response-surface-setup. Local Sensitivity Curves allow you to graphically view the impact that changing each input parameter has on the output parameters. The Local Sensitivity Curves chart helps you to focus your analysis by allowing you to view independent parameter variations within the standard Local Sensitivity chart. This multi-curve chart provides a means of viewing the impact of each input parameter on specific outputs, given the current values of the other parameters. The Local Sensitivities Curves chart shows individual local sensitivities, with a separate curve to represent the impact of each input on one or two outputs.
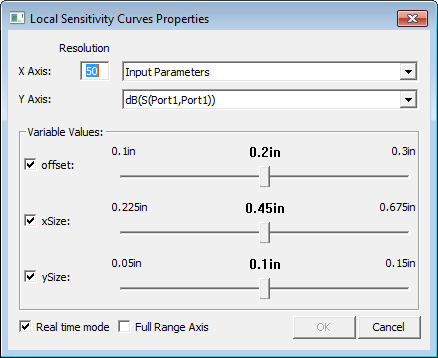
Clicking the ellipsis button [...] opens the Local Sensitivity Properties dialog that lets you adjust the variables selected and the values applied.