
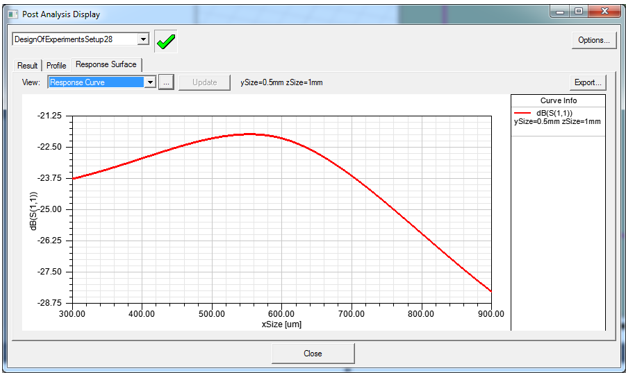
Response Curve
When Continuous Variable is chosen as the X-axis, and Continuous XY plot will be shown.
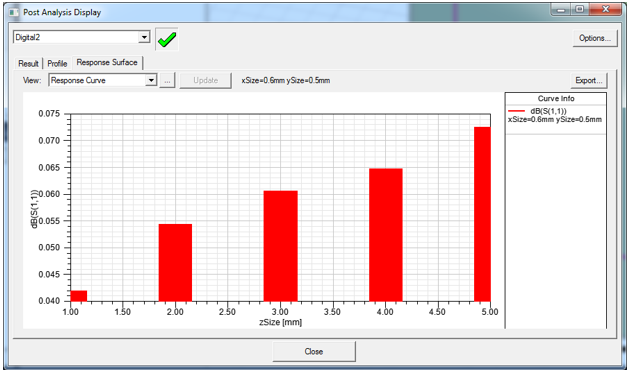
Discrete Variable
If you choose Discrete Variable as the X-axis, a bar chart plot is shown:
Tuning a Response Curve
For the X Axis and Y Axis, you can specify a Resolution, and the variable to use. For the Z Axis you can select the Cost or calculation. For variables not selected for the X and Y axis, a slider is enabled that lets you adjust the value to see the effect on the response curve plot. You can enable or disable Real time mode by using the check box at the lower left.
Full Range Axis check box
When it is checked all Axes are set to their maximum ranges, and the ranges won’t be changed while tuning unless you change the axis variable.
When it is unchecked, the Y(2D)/Z(3D) axis range is auto updated to fit the curve/surface.
Accumulate Response Curve
It always be unchecked when the tuning dialog started, and won’t restore it last check/uncheck state. When it is checked, it will retaining the existing curves, and add new curve to the plot. Uncheck the check box won’t clear the accumulated curves, just stop to accumulate new curve. When the Axis variable is changed, all accumulated curves will be cleared.
Exporting Response Curve Data
You can Export the response curve data as a table in the following formats:
- Comma delimited data files, (*.csv)
- Tab delimited data files, (*.tab)
- Ansys Plot data files, (*.dat)
- Post Processor format data files, (*.txt)
- Ansys Report Data *.rdat files
Exported files can be imported into a report.