


During a System Coupling run, information on the progress of the run will be written to a System Coupling log file named scLog.scl and to standard output (or transcript). The scLog.scl file is placed in a subfolder "SyC" in your working directory. You can use this to confirm the setup's correctness and to monitor the progress of the coupled simulation. This section provides an overview of how to monitor the coupled simulation's progress and results. For more information about the writing of the System Coupling log and transcript files, refer to Transcript and Log File in the System Coupling User's Guide.
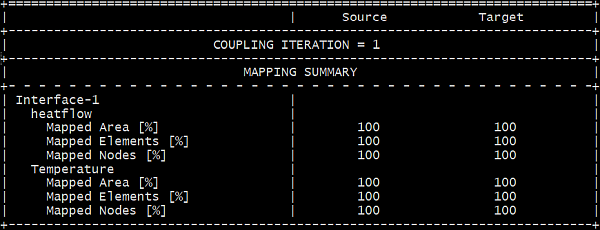
To have a successful coupled simulation, it is important to make sure that coupling interfaces, which are common surfaces shared by the simulation domains of participants, are defined consistently in the participants. Once the participants are loaded and before the first coupled iteration starts, you can check whether the coupling interface's mapping between the participants is successful. As shown in Figure 9.9: Information on mapping the coupling interface written to standard output , the percentages of mapped area, elements, and nodes for "Interface-1" are printed in the output. It is desirable to have greater than 95% mapping of area, elements, and nodes, for all the coupling interfaces defined. If the mapping is less than 95% for a certain coupling interface, Ansys suggests checking its geometry and boundary condition setup in the relevant participants. Find any problems and fix them, before running the coupled simulation.
You can monitor the coupled simulation in scLog.scl or the standard output by checking the status of
data transferred on the coupling interface in each iteration or coupling time step.
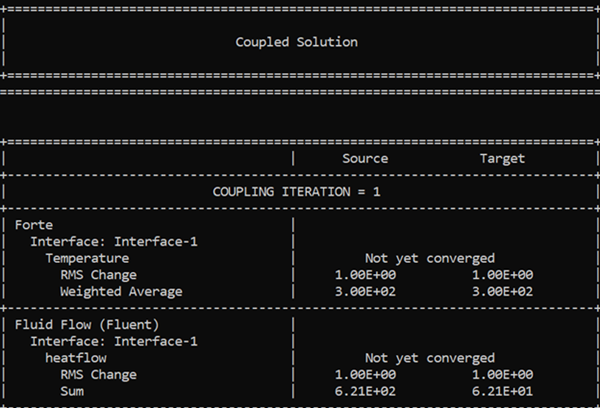
When the first coupling iteration (or time step) starts, you will see the printout
as shown in Figure 9.10: Status of the first coupling iteration when it starts, written to standard
output. Since this is the
first iteration, data transfer (in this example, Temperature and heatflow) on the
coupling interface have "not yet converged". The printout could take a pause here,
since the two participants, Forte and Fluent, are running their
simulations.
The way that the System Coupling works is that in each coupling iteration, one of participants is run first. When it finishes, it transfers data to the other participant, which will take over and start itself. After its simulation is done, it transfers data back to the first participant. This completes one coupling iteration.
Which participant runs first during a coupling iteration depends on the order that the participants are added when the simulation is set up. A general rule is that the participant added first will run first. For example, when Fluent is the first participant added and Forte the second, then Fluent runs first and then Forte runs second.
However, when Forte is the first participant added and Fluent the second, then Forte starts to solve first, but it would ask for the inputs from System Coupling for the data on its coupling interface. For this reason, System Coupling fires off a Fluent solve to provide the requested data.
Tip: You may check each participant's running status by stepping into their subfolders and monitor their log files or journal files.
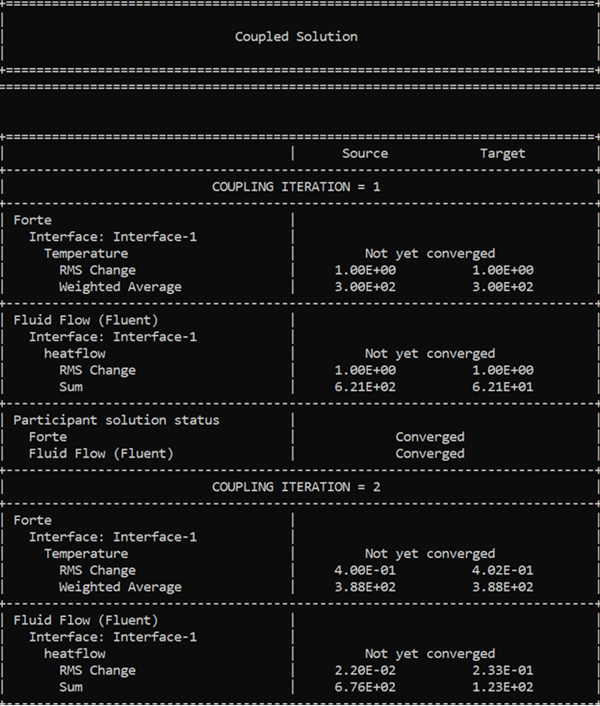
After both participants finish their simulations successfully, you will see their solution status as shown in Figure 9.11: Status of the simulation after the first coupling iteration finishes, written to standard output. The coupled simulation now proceeds to the second coupling iteration. The printout could take a pause here again, since the two participants, Forte and Fluent, are running their simulations in the second round.
Figure 9.11: Status of the simulation after the first coupling iteration finishes, written to standard output
As the coupled simulation proceeds, you should see the "RMS Change" of the data transferred reducing. This means that the values of data transferred are converging on a iteration-by-iteration basis. The "RMS Change", which stands for "Root Mean Squared change", is the averaged and normalized iteration-by-iteration change of data transferred on the coupling interface.
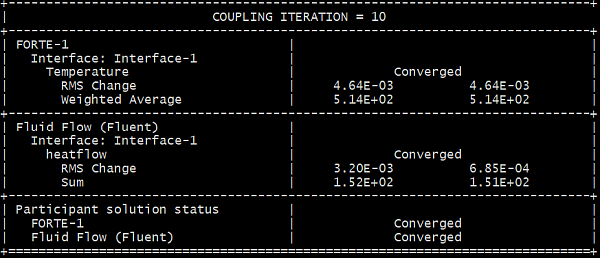
Figure 9.12: Status of a coupled iteration in standard output when the simulation converges shows the information written for iteration #10, which is the final iteration to reach convergence in our example. On the coupling interface ("Interface-1"), the RMS change of two-way data transfer (for "heatflow" and "Temperature") are displayed. By default, coupled simulation is regarded as converged when the RMS changes on the coupling interfaces are reduced to less than 1%. This is satisfied for both "heatflow" and "Temperature" as shown in Figure 9.12: Status of a coupled iteration in standard output when the simulation converges. Also displayed are the Weighted Averaged or the Summed values of the data on the coupling interface, depending on which type of solution data is transferred.
The standard scLog.scl output can also be displayed as a chart by activating the beta features (Forte Edit > Preferences) and adding to the python_script.py the following lines:
dm.ActivateHidden.BetaFeatures = True
DatamodelRoot().OutputControl.GenerateCSVChartOutput = True
If the System Coupling Graphical User Interface is used instead, type in the System Coupling console the line:
WriteCsvChartFiles()
When the run has converged and completed, you can step into each participant's subfolder to examine their final solutions.