


When you click the Analyze Results option on the Ansys Chemkin Interface (see Post-process the Solution in the Chemkin Getting Started Guide) or when you open a solution file from within the Chemkin Visualizer, the Select File and then the Select Results to Load from Solution File dialogs will appear. This dialog (see Figure 2.12: Results to Import—Solution Sets) is divided into three tabs: Solutions Sets, Species/Variables and Units of Measure.
The dialog also contains two action buttons, OK and Cancel. OK will proceed to the Visualizer Control Panel. Cancel will exit out of the Ansys Chemkin Visualizer.
The Solutions Sets tab is displayed by default. If Ansys Chemkin produces only one solution set, the dialog will instead display the Species/Variable tab and the Solutions Sets tab will be disabled. Each tab is described in the sections below.
The Solutions Sets tab shown in Figure 2.12: Results to Import—Solution Sets allows you to choose which solution set you would like to plot.
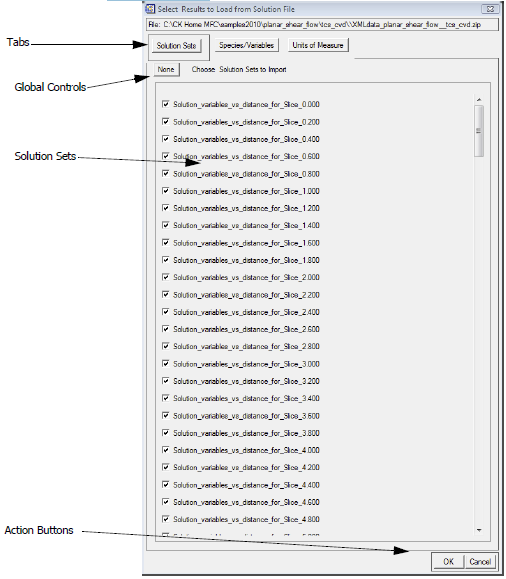
The None/All toggle button allows you to select or deselect all the solution sets at one time. Additionally, there is a series of check boxes next to each of the individual solution sets available from the Ansys Chemkin solution. The check boxes can be selected individually or the None/All toggle button can be used for global selections.
The Species/Variables tab shown in Figure 2.13: Results to Import—Species/Variables allows you to select the specific data to be loaded into the Ansys Chemkin Visualizer. The tab includes several methods for selecting data, including the Global Controls, Data Options check boxes, Top/Bottom Controls and the Fraction Range Filter areas.
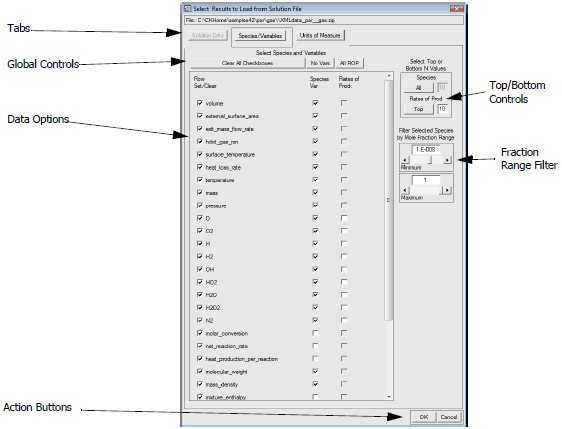
The global controls consist of toggle buttons that allow you to quickly select or deselect species and variables you wish to plot. Depending on the Ansys Chemkin reactor model there will be four toggle buttons:
Clear All Check boxes toggle button deselects all the species and variables. This can be useful if you only want to select a few items.
No Vars/All Vars toggle button selects or deselects all items in the Species/Variable column. The Species/Variable column lists all the available species or other variable data.
No Sens/All Sens toggle button select or deselects all items in the Sensitivity column, when sensitivity data are available.
No ROP/All ROP toggle button selects or deselects all the items in the Rate of Production column. This column allows selection of rates of production contributions of reactions to each species by name. You may need to scroll the dialog to find a specific species in the list.
Depending on the output created by an Ansys Chemkin reactor model, some of the columns may not appear. For example, if sensitivity output was not selected in the Chemkin interface prior to generating the Chemkin Solution, the dialog will not include a Sensitivity column (as in Figure 2.13: Results to Import—Species/Variables).
The Species/Variables tab lists all the data that can be plotted by the Ansys Chemkin Visualizer with a check box to the left of each row or item within the row that can be selected or deselected to produce a specific data element. The first column allows selection or deselection of a row in the data set and the other check boxes can the be selected or deselected on an individual basis.
In addition to the variables calculated as part of the Ansys Chemkin solution, there are many derived calculations listed. These include species net rates of production (ROP), net rate of progress of reactions (net_reaction_rate), and in some cases, molar conversion of principal components. When ROP is selected for a species, the net rates of production of that species for each reaction will be included in the data for post-processing, subject to the filters in the Top/Bottom Controls. When net_reaction_rate is selected, the net rate of progress of all reactions will be included in the data for post-processing (these are not subject to the Top/Bottom Controls). Rates of production and rates of progress of reactions are defined in detail in the Chemkin Theory Manual.
Selecting molar conversions will result in the calculation of molar conversion rates for any species that has an initial or inlet mole fraction greater than 1.E-9. The molar conversions are simply defined as the percent change in mole fraction and therefore do not account for changes in total moles of the system due to large temperature or pressure changes. This latter calculation is useful in isobaric systems where gas-phase temperature changes are small. For reactor models that provide temporal or spatial data, the molar conversions are also provided as a function of time or distance.
The Top/Bottom Controls allow filtering of the values of species fractions (Species), reaction sensitivity (Sens) or species rates of production (Rates of Prod) that will be brought into the Visualizer. You may select the Top (or Bottom) values (for example, the 10 species with the largest mole fractions). The number can be specified in the available text box (default is 10), while the All/Top/Bottom toggle button determines how the data will be filtered.
Note: When you select top/bottom #N species in the post-processor for a transient problem, it picks the N number of species based on their maximum values throughout the reaction time. For example, at one point in time, species A may be present in very high amounts but species B may be high later in the reaction. Then maximum levels of both A and B will be used to order the top or bottom order of species.
The Mole Fraction Range Filter provides an alternate method to selecting species for importing data into the post-processor. Here, you can select the range of species mole fractions in decades. Use either the Minimum and Maximum slider controls or type directly into the text boxes.
The Units of Measure tab shown in Figure 2.14: Results to Import—Units of Measure allows selection of the units of measure for the plot data. This tab consists of some Global Controls, as well as controls of individual items. The default settings are based on User Preferences set in the Ansys Chemkin Preferences panel for the Visualizer.
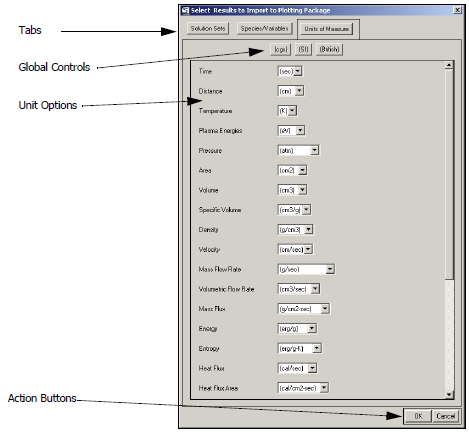
The global controls allow selection of a global system of units based on centimeter/gram/second (cgs), Système International d’Unités (SI) or British Units standards of measurement. Choose either one by clicking the (cgs) or (SI) or British buttons. These buttons will select a predetermined set of unit options in the list below, overriding any custom selections that were previously made.
You can customize the units of measure using a series of drop-down lists in the Unit Options area. These options temporarily override your default settings during the post-processing session. Default settings are controlled by the Preferences panel in the Ansys Chemkin Interface, as described in Managing Preferences.