


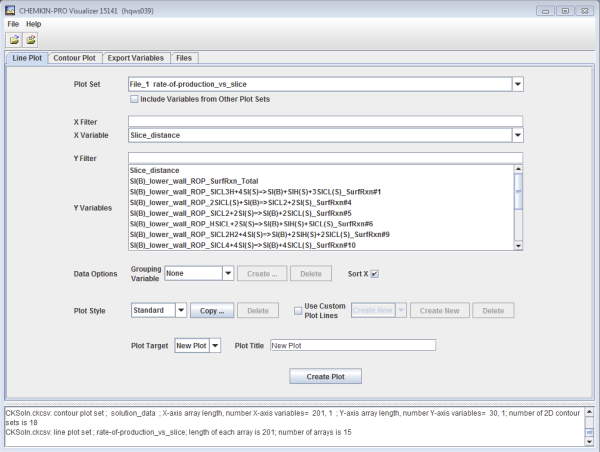
Within the Control panel, below the menu toolbar, are a series of Control Tabs from left to right that allow switching between different control panels. The default control tab is the Line Plot tab. The Contour Plot tab allows 3-D contour data to be displayed. The remaining Control Tabs allow export of the data that is being considered in the plotting session and a read-only display of the data files that have been opened for use. Details on the inputs for each of these Control Tabs are in the following sections.
Line Plot Type
Include Variables from Other Plot Sets - By default, only variables for a single plot set are available for selection. For instance, slice1 may contain distance (or time) and several dependent variables, such as mass fractions, temperature, pressure, etc. Any 2 variables can be used to create an XY line plot. In some of the 1-D reactor models and in parameter studies, there may be many plot sets created; such as slices at varying distances along a shear-layer flow channel or a solution set that just contains wall data as a function of axial distance. As long as the dimensions of the solution sets are compatible, you can plot solutions from different solution sets on the same plot. To do that, use the Include Variables from Other Plot Sets check box near the top of the tab. Clicking this box will activate a message dialog that allows you to specify more than one plot set from which to select XY variables. Only those plot sets with the same number of items will be available for selection, as shown in Figure 2.3: Select Additional Plot Sets dialog:
X Filter - Narrows the list displayed for X Variable to only those variables whose names start with the string typed into the filter.
X Variable - The independent variable for the XY line plot.
Y Filter - Narrows the list displayed for Y Variable to only those variables whose names start with the string typed into the filter.
Y Variable - The dependent variable(s) for the XY line plot(s). You can select one or multiple Y variables to plot against the X variable.
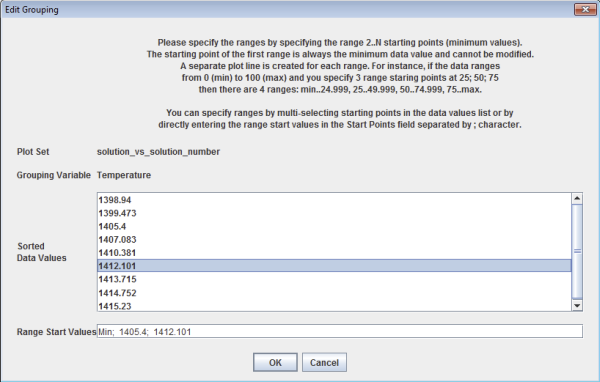
Grouping Variable - This drop list allows you to select a 3rd variable (neither X nor Y) from the same plot set (or merged plot sets), which will be used to subdivide the XY plot points into multiple plot line segments. Use the Create New option within the drop list to define a new grouping variable. Figure 2.4: Select Grouping Ranges dialog shows an example dialog with Temperature selected to be the grouping variable.
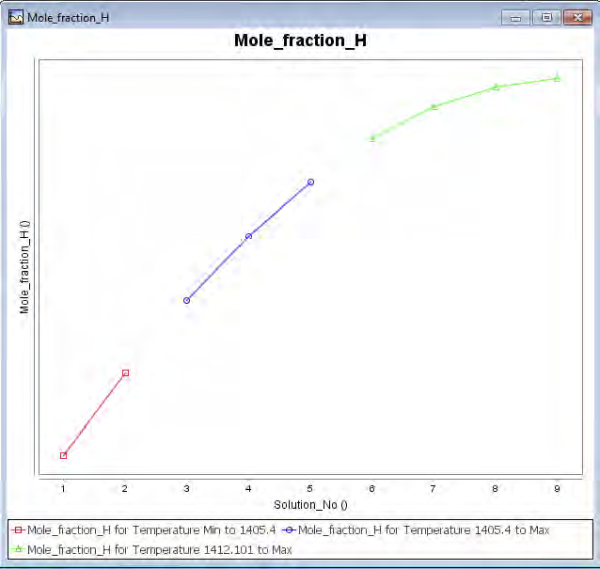
The resulting plot of Solution No. versus Mole fraction H Figure 2.5: Plot lines resulting from multiple range start points (Figure 2-4) shows that adding two range start points (in addition to the Min value, which always starts the first range) results in three plot line segments.
Sort on X - Check this box to cause the X variable to be sorted (only for this plot). Most Ansys Chemkin independent variables are already sorted, but imported data may not be sorted. Since the line plot is essentially a connection of line segments from one XY point to the next, you may need to sort the X variable in some cases.
Plot Style - The default Standard plot style can be supplemented by as many alternative plot styles as you would like using either Create New style or the Copy button to make a copy of the Standard style and then modify it. The Plot Style dialog is described more fully in Section 2.1.2.2.
Use Custom Plot Lines - This setting supplements the Plot Style and allows even more control over how each plot line is displayed. This dialog is also described more fully below.
Plot Target - By default, each plot is displayed in a new window. For line plots, you can select to have the plot line(s) added into an existing plot window by selecting the specific plot name from this droplist. If you choose a different Plot Style or Custom Plot Lines setting, these style and settings are applied to all the plot lines including those previously plotted.

The Plot Style dialog allows you to define the way your plot lines, axes, labels, and other elements are rendered. You have much more ability to control the rendering as the plot is being generated than once the plot window is created, and you can save your style choices for reuse. The Plot Style dialog panel has three tabs, as shown in Figure 2.6: Plot Style dialog.
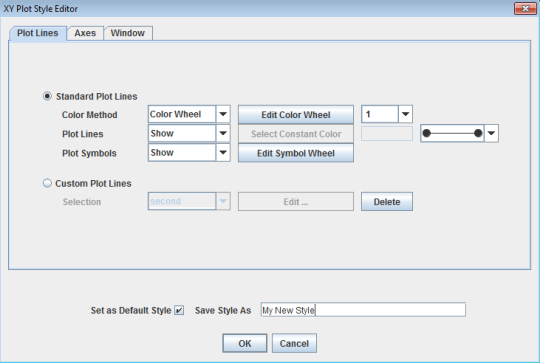
Standard Plot Lines or Custom Plot Lines - The first choice is whether to use Standard Plot Lines or Custom Plot Lines. The standard plot lines style option allows you to select either constant colors or select a color "wheel" (a list of colors that are used in succession for the 1st, 2nd, … lines of a plot). You can choose whether lines, symbols, or both are displayed and control the line thickness. The symbol wheel behaves analogously to the color wheel. The Custom Plot Lines option uses a special custom plot lines style (a named Custom Plot Lines style) defined in a separate dialog. This controls the color, symbol, line style, etc., for each plot line separately and gives you maximum control in defining your plot appearance.
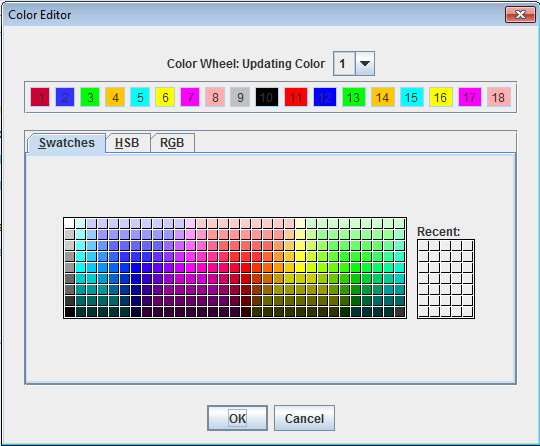
Color Method - This drop-list allows you to select from either a constant color or using the color wheel. The button allows you to modify the color wheel values and select different colors to be used. There is only one color wheel, so this change affects all future plots generated using the color wheel. The Integer drop-list on the right is the starting point within the Color Wheel for the first plot line. You can specify this differently within each Plot Style if you wish to do so. Since the Color Wheel has 18 colors and you are unlikely to create plots with that many lines, you can use this to employ different segments of the Color Wheel in different Plot Styles. Click on the Color Swatch you prefer for each of the 18 colors shown in the numbered list. You can select 18 different colors or reuse colors by clicking on the same swatch. You can use the HSB or RGB tabs to specify the colors numerically. See Figure 2.7: Color Editor.
Plot Lines - Use this to show or hide the plot lines. If you selected the Constant Color option for Color Method, then specify that color here. You can also choose the line style that will be used for all plot lines when this Plot Style is used.
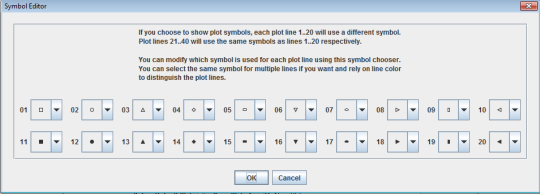
Plot Symbols - Use this to show or hide the plot symbols. Use the Edit Symbol Wheel button to show a dialog that allows you to select the order in which the plot symbols are assigned to plot lines.
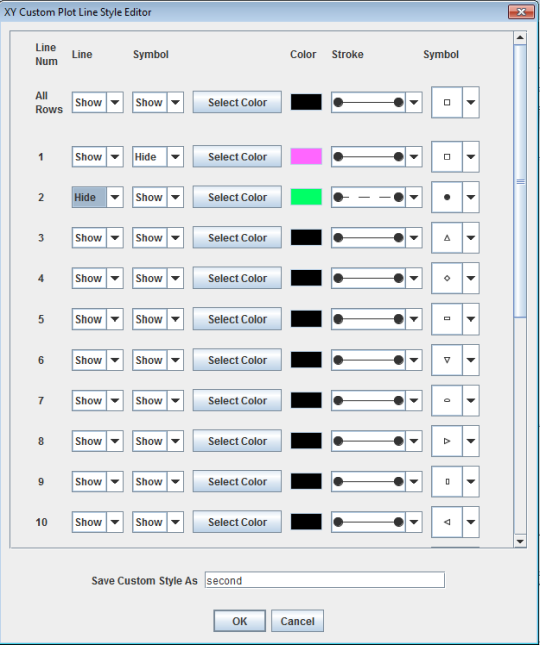
Selection (of Custom Plot Lines) - Use this to select an existing Custom Plot Lines style element or use Create New to define a new Custom Plot Lines style. This custom style element allows a different plot line style for each plot line, as shown here:
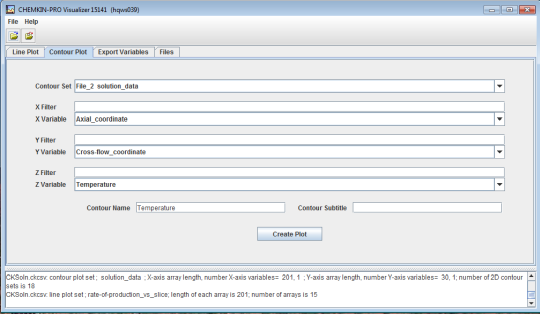
Contour Plot Type
Contour Set - The set contains a consistent set of data that can be used for constructing a contour plot. Specify the X, Y, and Z dimension values.
X Filter - Narrows the list displayed for X Variable to only those variables whose names start with the string typed into the filter.
X Variable - The first independent variable for the contour plot. For contour plots, the X and Y axis choices are vectors and the Z choice is a 2-D plane of points corresponding to the X/Y values. Only one choice may be made for the X variable from a drop-list of choices.
Y Filter - Narrows the list displayed for Y Variable to only those variables whose names start with the string typed into the filter.
Y Variable - The second independent variable for the contour plot. As shown above, this is a drop-list field for selecting the Y axis of a contour plot.
Z Variable - The dependent variable for a contour plot. This is a 2-D plane for contour plot and only one selection can be made per contour plot. No over-plotting of contour plots is allowed.
Contour Name - The name of the plot created for display on the plot and for contour plot history file.
Contour Subtitle - A smaller font subtitle can also be displayed on the contour plot.
Create Contour - This button triggers the creation of a new window containing the requested plot.
The Export Variables tab allows you to export subsets of XY line plot data from the current session. An example of the Export Variables tab is shown in Figure 2.11: Export Variables Tab - Export Line Plot data to CSV file. The possible operations that can be performed on the data from this panel are described in the following descriptions.
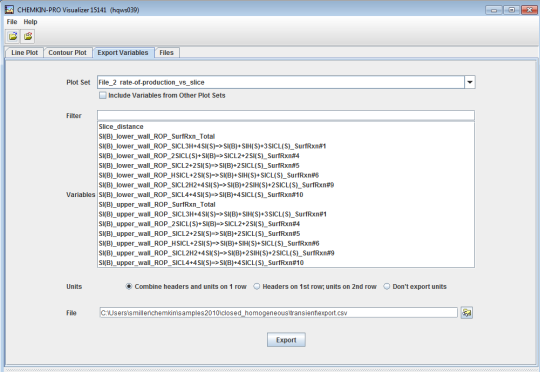
Include Variables from Other Plot Sets - By default, only variables for a single plot set are available for selection. Clicking this box will activate a message dialog that allows you to specify more than one plot set from which to select variables. Only those plot sets with the same number of items will be available for selection, as shown in Figure 2.3: Select Additional Plot Sets dialog.
Filter - Narrows the list displayed for Variable to only those variables whose names start with the string typed into the filter.
Variables - Variables to export from the plot set(s)
Data Type and Variable choices - The choices displayed here are the same choices as those provided in the Line Plot Tab (Plot Lines tab): Line Plot or Contour Plot, along with selecting Plot Sets and variables.
Units - The header row and units format choice determines the format of the exported file.
Export button - Launches a file selection dialog that allows selection of the file (new or existing) that will receive the exported data. If the file already exists, it will be overwritten, not appended.
This tab simply presents a reference list of the data files that have been loaded into the Visualizer session. If all of the plot/contour sets loaded from a file are freed from memory, the file will still be listed. This information is provided here as a cross-reference to the file numbers used when displaying the Contour Set and Plot Set choices.