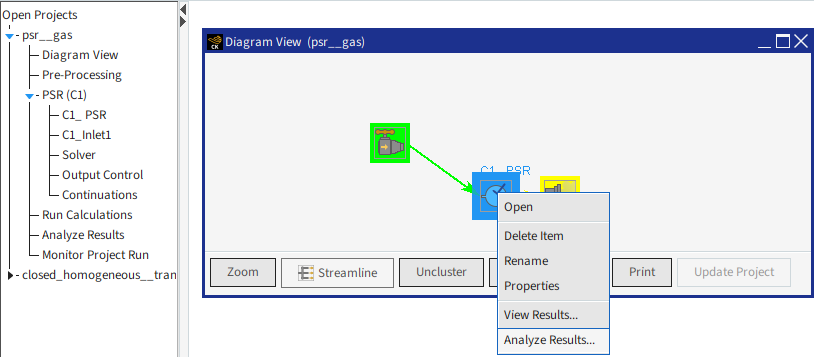
The Visualizer can be launched from the project-tree Analyze Results node or by right-clicking the C1_PSR reactor and selecting Analyze Results, as shown in Figure 2.18: psr__gas.ckprj—Analyze Results. After a successful simulation, the Analyze Results panel will automatically appear.
This opens the Analyze Results panel with default selections of PSR (C1) for Solution to View and Plot Results for Method of Analysis. In some cases there are drop-down menus with further choices.
Note: Tip: You can choose to use:
The Ansys Chemkin Visualizer (the default)
Microsoft Excel© (Windows platforms only)
to post-process data from runs at this point, by selecting Plot Results by Selecting New Settings and marking a check-box at the bottom of the Select Post-Processing Variables panel. Information about these options is available in the Chemkin Visualization Manual.
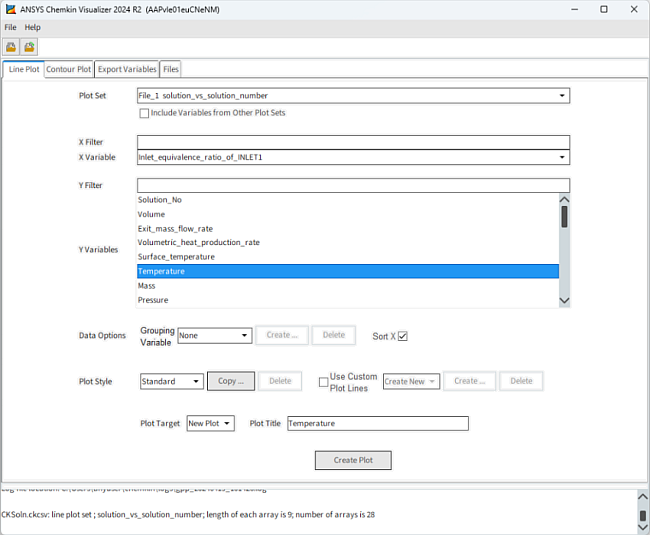
Click the button. In this case, the Visualizer will automatically open the solution file for the associated reactor cluster, which will be located in the Working Directory of the project. When opening a solution file, the Visualizer presents the default Line Plot panel. Here you can choose which X and Y variables you would like to plot, as well as the type of plot you would like to see. Tabs for Contour Plot and Export Variables and Files are also available.
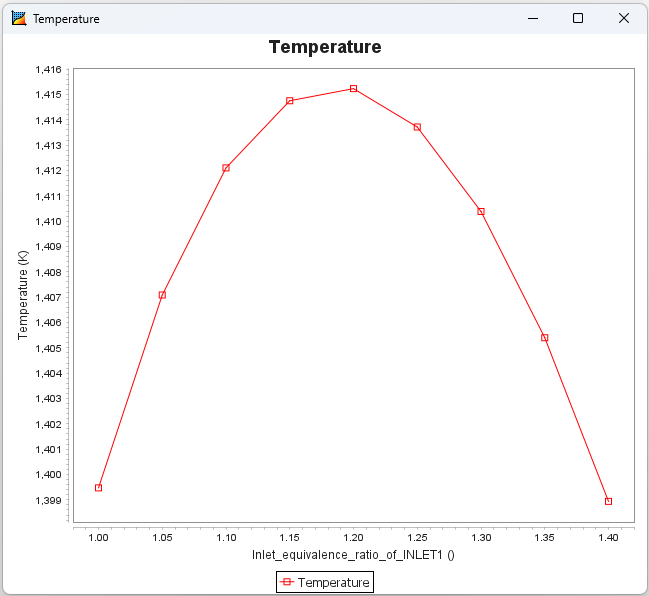
For the X Variable, choose Inlet equivalence ratio of INLET1 from the drop list, and choose Temperature as the Y Variable.
Accept all other defaults and click Create Plot. A plot as shown in Figure 2.20: psr__gas.ckprj—Visualizer Example Plot will be produced. For more details about post-processing, review the Chemkin Visualization Manual.