Signal Net Analyzer
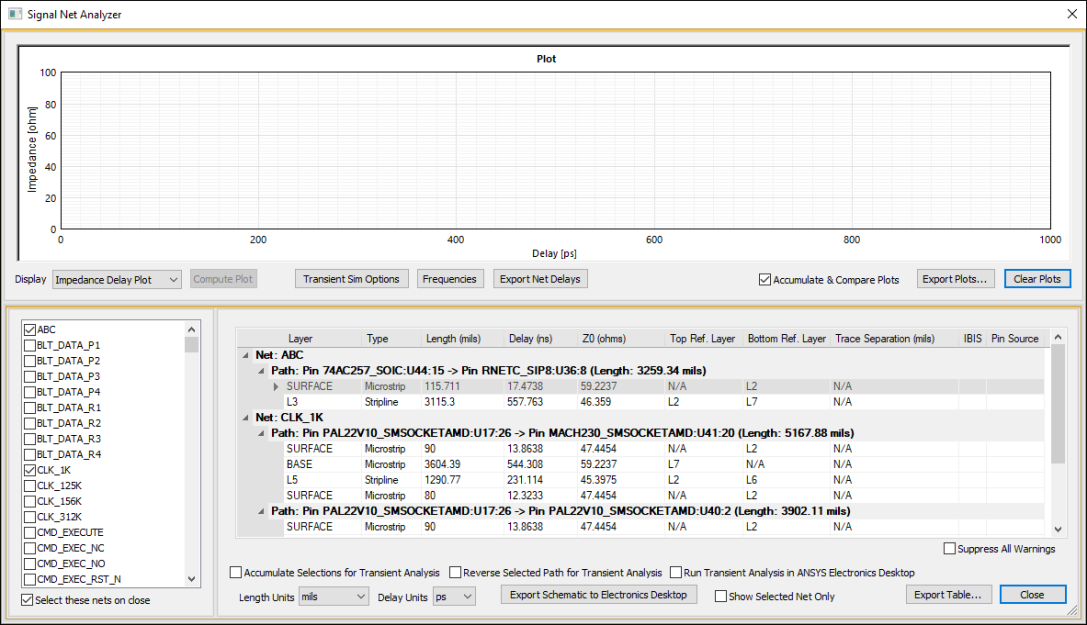
The Signal Net Analyzer gives you the ability to get a quick idea of characteristic impedance and to rapidly generate transient voltage waveforms of pin-to-pin signal propagation. The Signal Net Analyzer generates an impedance delay plot for each trace path selected.
Traces comprising propagation paths are modeled as frequency dependent W-element transmission lines. Source/sink pins can (optionally) have IBIS driver/receiver models. When a trace passes over a cutout or void, the trace is split and the sections before and after the split may have different Z0 values since they see different references. The Signal Net Analyzer’s 2D Method of Moments (MoM) solver allows you to investigate the cross-section of the transmission line—Z0 will be higher in the void regions. The MoM solver generates a frequency-dependent W-element for each trace segment, and a lumped RCG (no L) model for each via. You can plot the transient response using time-domain Ansys Nexxim or HSPICE.
Before running the Signal Net Analyzer, two preliminary steps are recommended:
- Set the frequencies for the Signal Net Analyzer to employ in its analysis. See: Changing Signal Net Analyzer Options.
- Define IBIS buffer models for any pins to be analyzed. See: Defining IBIS Models for Pins .
To use the Signal Net Analyzer in SIwave:
- Click Simulation.
- Use the Signal Net Analyzer drop-down menu to select Signal Net Analyzer.
- Net Selection Pane – located to the bottom-left, this pane allows you to select nets for analysis.Note:
- You must make a selection in this pane before the functionality of the Plot and Options panes will be enabled.
- You can also select nets by clicking objects belonging to the net in the Modeling workspace.
- Selecting power/ground nets will result in a warning message. You can suppress these messages from the Options pane.
- Plot Pane – located at the top of the window, this pane displays offers plotting options.
From here, you can:
- View the selected plot. Use the Display drop-down menu to select the type of plot you want to see (impedance vs. delay plot or transient response plot), then click Compute Plot to view the plot.
- Enable or disable Accumulate & Compare Plots. By default, this is enabled, which allows the pane to display multiple plots. Deselect to view a single plot.
- Reset the plot area by clicking Clear Plots.
- Click Export Plots to save the data as a *.CSV or *.TXT file.
- Click Export Net Delays to export a net delay report.
- Options Pane – located to the bottom-right, this pane allows you to view additional details about the selected net(s) and change analysis options. While nets are loading, a green progress bar in this pane shows the loading status.
From here, you can:
- Select units of measure for display using the drop-down menus.
- Click Suppress All Warnings to ignore any warning messages.
- Export a Circuit schematic to Electronics Desktop. Use the check boxes to select Transient analysis options, then click Export Schematic to Electronics Desktop. For more information on these options, consult the Circuit help.
- Click Export Table to export the table of selected nets in either *.CSV or *.TXT format.
The Signal Net Analyzer window appears.

The Signal Net Analyzer window contains three panes:
