Setting up an Arbitrary Near Fields Point List
To evaluate the near fields using an arbitrary points, set up an external points list using a global or local coordinate system. The *.pts file format (which is used for exporting field data and specifying field point locations in the Fields Calculator – Export dialog) is also used for specifying 3D near field point locations. Be sure to check “Compute Fields” on the General tab on the Solution Setup.
- Prepare a *.pts file format file.
- Click HFSS >Radiation>Insert Near Field Setup>Points List.
The Near Field Radiation Points List Setup dialog box appears. If the HFSS design is Modal/Terminal Solution type the dialogue includes a Radiation Surface tab. If the design is SBR+ the dialogue does not include the Radiation Surface tab
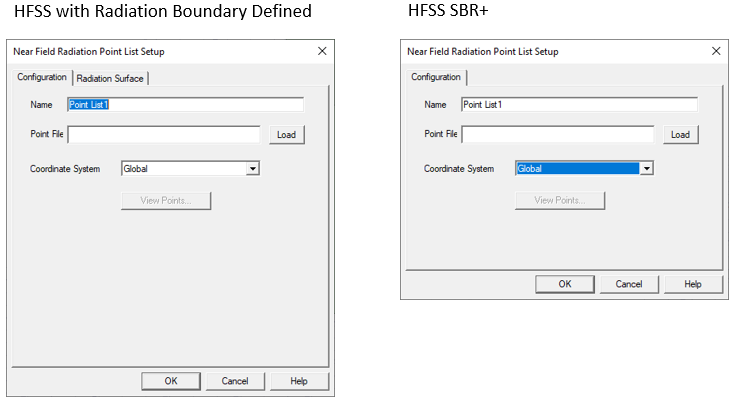
With SBR+ designs, a Near Field Domain Setup is defined or selected before simulation using the Field Observation Domain pane in the SBR+ Solution setup Options tab or the Hybrid tab of an HFSS Modal or Terminal setup. (For a solution type other than hybrid or SBR+, you can create and configure a near field radiation setup using File-Based Point List after simulation).
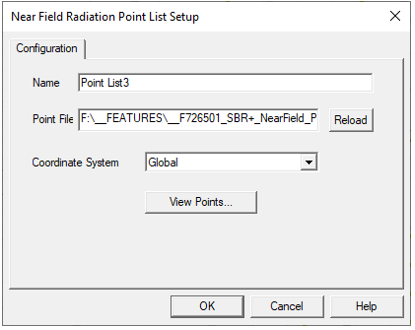
- Type a name for the point list in the Name text box.
- Select the points file for which you want to evaluate the near fields. Pressing the Load button opens a browser.
- For a Modal or Terminal design, click the Radiation Surface tab.
By default, the Use Boundary Radiation Surfaces radio button is selected.
To specify a surface other than an assigned radiation or PML boundary over which to integrate the radiated fields, you must first create a face list. To create a facelist see Creating a Face List. The face list cannot include a face that lies on a PML object.
If you have created one or more face lists, the Use Custom Radiation Surface radio button is enabled.
- Select Use Custom Radiation Surface.
This enables the Choose from existing face list field.
- Select a defined face list from drop down menu.
HFSS will use the surfaces in the face list as the radiating surfaces when calculating the near fields.
- Click OK.
HFSS renders the near field points in the 3D model window.
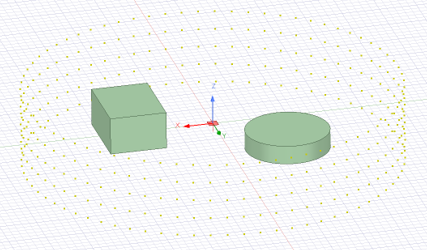
The View Points button is enabled and provides a data table view of the XYZ point coordinates loaded from the specified *.pts file.
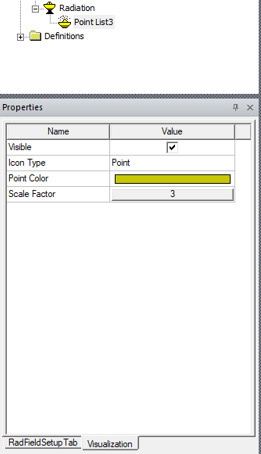
When you select the Radiation Near Field setup in the Project tree, the Properties includes a Visualization tab.
-
Visible [On/Off]
-
Icon Type [Point, Sphere, Box, Dot, Plus]
-
Point Color (colored button, brings up color chooser)
-
Scale Factor (sets size of marker)
When a radiation surface is used, you must have defined at least one radiation or PML boundary in the design for HFSS to compute near-field quantities, regardless of which radiation surfaces you instruct HFSS to use when calculating the near fields.
Generating a Report from Point List
To Generate a Report from a Point List simulation.
-
Under Results node in the Project tree select Near Fields Report > Data Table.
This opens the Report dialog.
-
Under the Context setup in the Report dialog, set the Geometry selection to the created near field Point List radiation setup; notice the only Primary Sweep available is the point list Index.
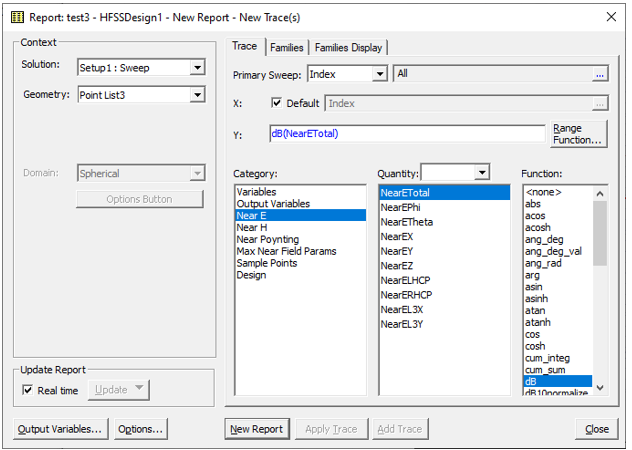
Select the desired Category, Quantity, and Function (such as Near E, NearETotal, dB). Notice that the Category: list includes Sample Points.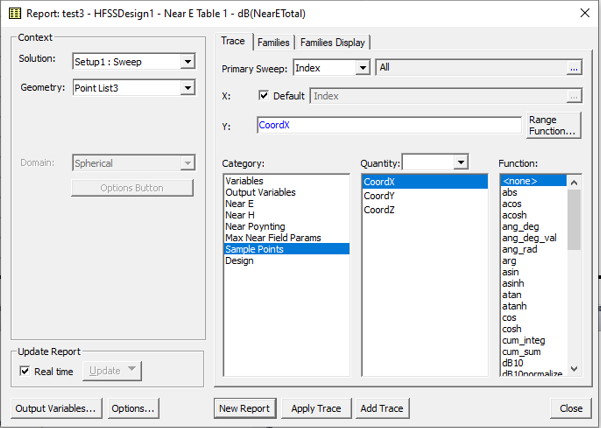
Selecting Sample Points as the Category then include the Quantities for CoordX, CoordY, and CoordZ.
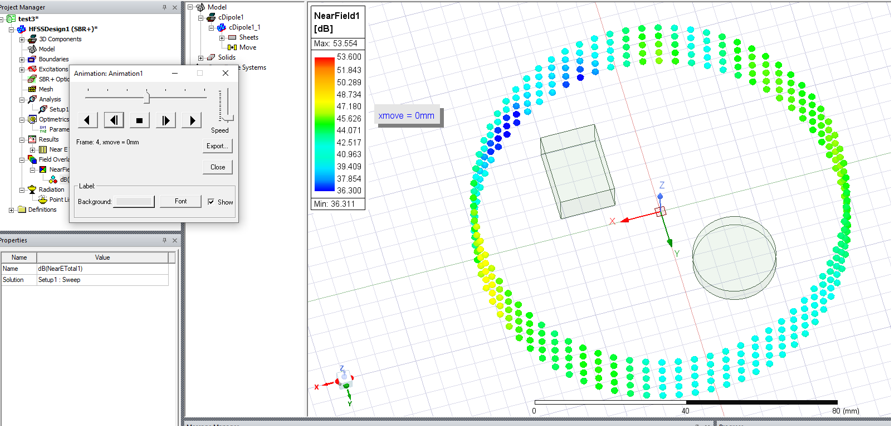
Animating an Near Field Points List Plot
To animate a near field points list plot:
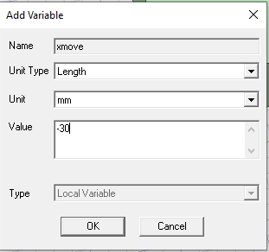
- Create a design or project variable for the position of a geometry object in the 3D model. You can do this This can be done by performing an Edit > Arrange > Move operation on the object, or by creating a new Coordinate System containing the design/project variable and assigning it as the Target Coordinate System for a geometry object.
- Then add an Optimetrics Parametric sweep setup.
Use the design/project variable that you created for the parametric sweep definition.
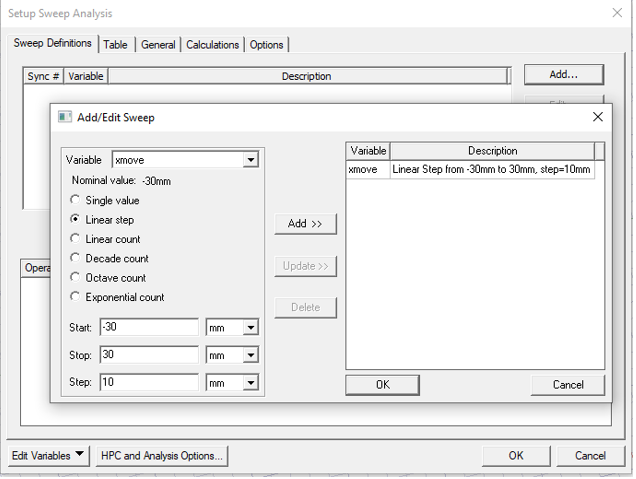
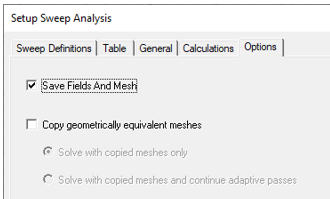
- Check “Save Fields and Mesh” on the Options page of the sweep setup.
- Run the Optimetrics simulation.
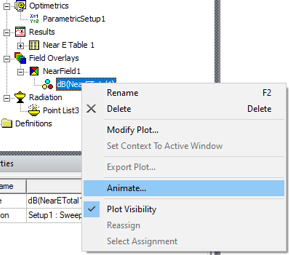
- After creating a Sampled Near Field Plot as described previously, right-click on the plot object and select Animate... to open the Create Animation Setup.
You can select the design/project variable from the list of available sweep variables and create a list of variable values to sweep for the animation. These values should be from the available simulation sweep values.
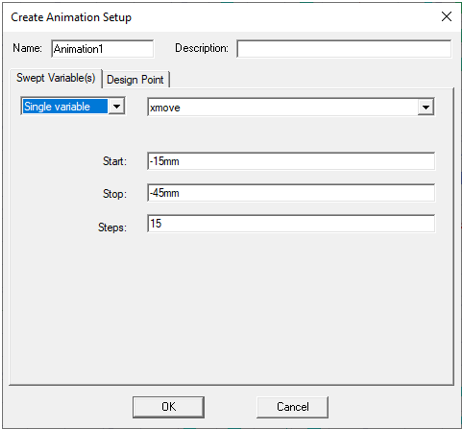
Or you can select the Parametric Setup to use the variable and all values from the specified Optimetric setup.
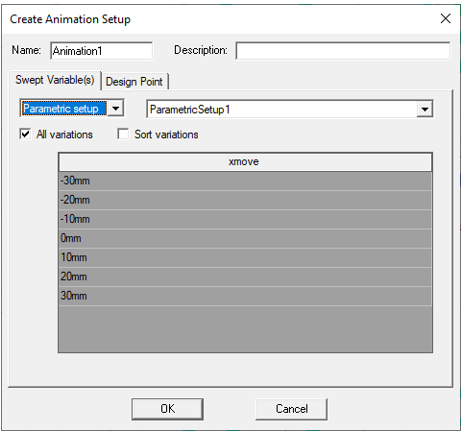
- Select the created animation sweep setup and click OK to generate the animation.