


The DOE Analysis Result is displayed in the working window during DOE simulation and the final analysis results can be reopened by clicking the button in the panel as shown in the figure below.
Additionally, the DFDOE file which contains the analysis result of DOE can be opened from the File Menu.
The analysis result window consists of three sections as shown in the figure and table below.
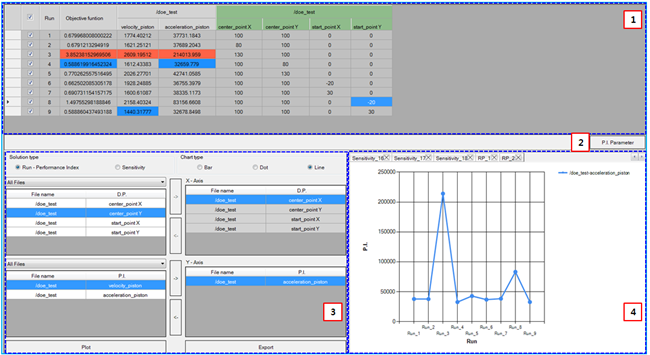
Figure 9.86: Description of DOE Analysis Result
| Parameter | Symbol | Description | Dimension (Range) |
| 1. Result Table | N/A | Use to show the DOE simulation results. For more information, see the Figure 9.87: Property of DOE result table and Figure 9.88: Description DOE result table properties. | N/A |
| 2. PI Parameter | N/A | Use to open Figure 9.79: Performance Index properties. When the result type, time duration, "MIN/MAX", or weight factor are modified, the DOE result table will be updated. | N/A |
| 3. Chart Control | N/A | Use to set the contents for the x and y axes of chart. For more information, see Figure 9.89: Chart control properties in DOE and Figure 9.90: Description of chart control properties in DOE. | N/A |
| 4. Chart | N/A | Use to draw the performance indexes for trials and sensitivity which means the variances of the performance indexes per variances of design parameter. The parameter study only supports the sensitivity. For more information, see Figure 9.91: Chart properties in DOE and Figure 9.92: Description of chart properties in DOE. | N/A |
The properties of the DOE result table are described in the figure and table below. For the objective function and performance index, the blue and red colors mean the best and worst solutions, respectively.
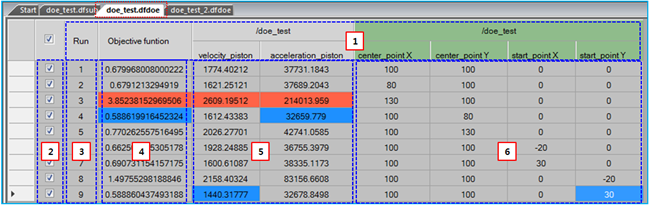
Figure 9.88: Description DOE result table properties


The chart control properties are described in the figure and table below. The chart control is used to set the x-axis and y-axis of the sensitivity chart and the y-axis of the "Run-PI" chart. The design parameters are the x-axis and the performance indexes are the y-axis for the "Sensitivity" chart. For the "Run-PI" chart, the no. of run is the x-axis and the performance indexes are the y-axis.
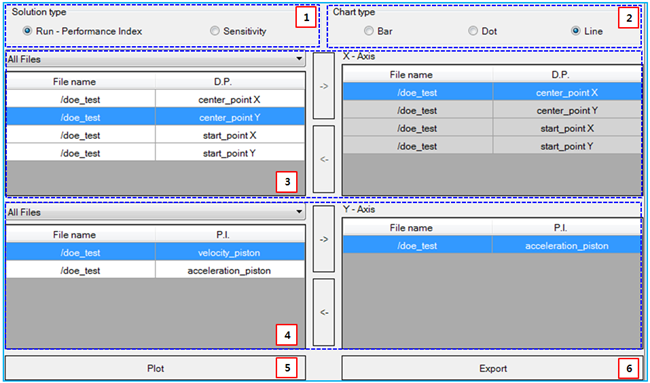
Figure 9.90: Description of chart control properties in DOE
The chart properties are described in the figure and table below. As shown in the figure below, the upper and lower graphs are the samples of line and bar types, respectively.
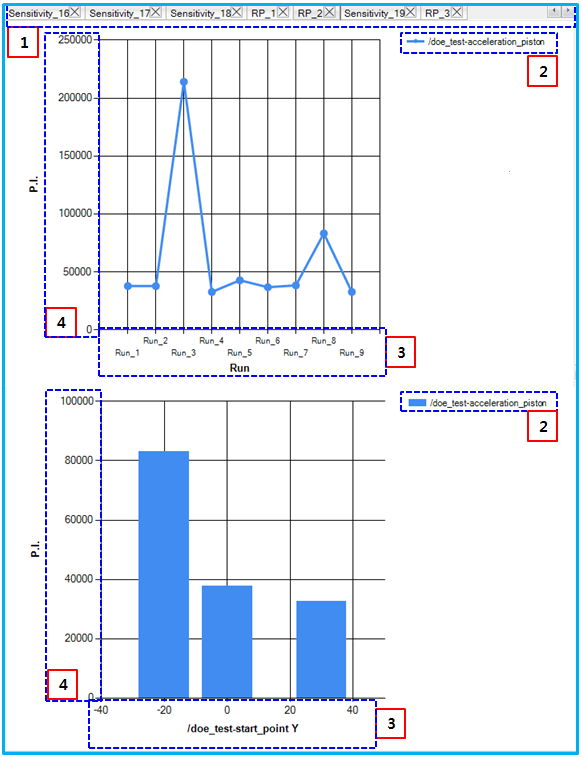
Figure 9.92: Description of chart properties in DOE