


This section examines the results of both the modal analysis of the global piping system and the nonlinear static analysis of the local elbows:
The table below compares the calculated fundamental natural frequency of entire piping system with the expected experimental result (Nie et al. (2008)). The close agreement between the simulation and the expected results validates the methods used in this analysis.
| Fundamental Frequency of Entire Nuclear Piping System | ||
|---|---|---|
| Modal Analysis Results | Measured Value in Experiment | |
| With Prestress Effects | Without Prestress Effects | |
| 6.3064 Hz | 6.2216 Hz | 5.9 - 6.3 Hz |
Note: Ansys Workbench Mechanical does not support power graphics and Von Mises Stress/Strain results for line bodies. Command snippets are used to evaluate USUM,Von Mises Stress and Strain (see below). For information on adding command snippets in Mechanical, see Commands (APDL).
/post1
/eshape,1
/graphics,power

!Settings for reverse video plot

/rgb,index,100,100,100,0
/rgb,index,80,80,80,13
/rgb,index,60,60,60,14
/rgb,index,0,0,0,15
jpgprf,,,1

/show,png
/view,1,-0.292,-.2178,0.931
/angle,1,57.875

set,last

! USUM plot of local elbow model with ELBOW290 elements
plnsol,u,sum
*GET,my_U_HAX,PLNS,O,MAX
esel,s,cent,x,8.7,9.0
esel,r,cent,y,4.2,4.5

! Von Mises stress plot of local elbow model with ELBOW290 element
plnsol,s,eqv
*GET,my_EQUIVAIENT_STRESS_MAX,PLNS,O,MAX

! Von Mises strain plot of local elbow model with ELBOW290 elements
plnsol,epto,eqv
4GET,my_EQUIVALENT_STRAIN_MAX,PLNS,O,MAX

allsel, all
This section compares the results and computational efficiency of the of the two local models (ELBOW290 and SHELL281) used to simulate the elbow depicted in Figure 8.3: Elbow Model Line Diagram.
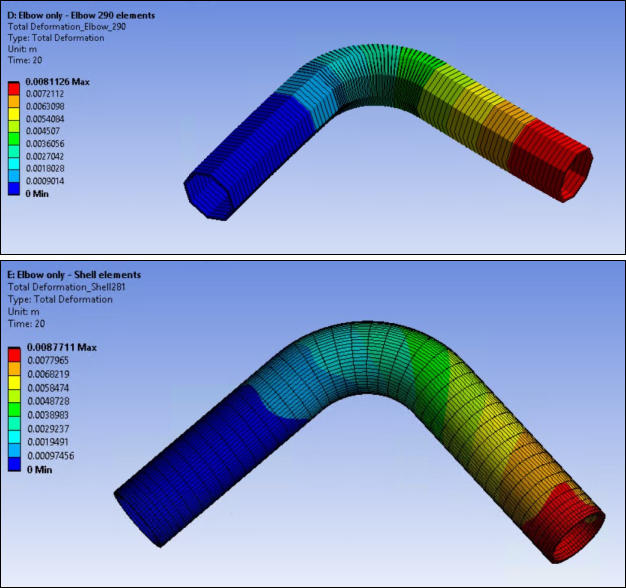
The final deformed shape of the local ELBOW290 model matches closely with that of the local SHELL281 model, as shown in the following figures.
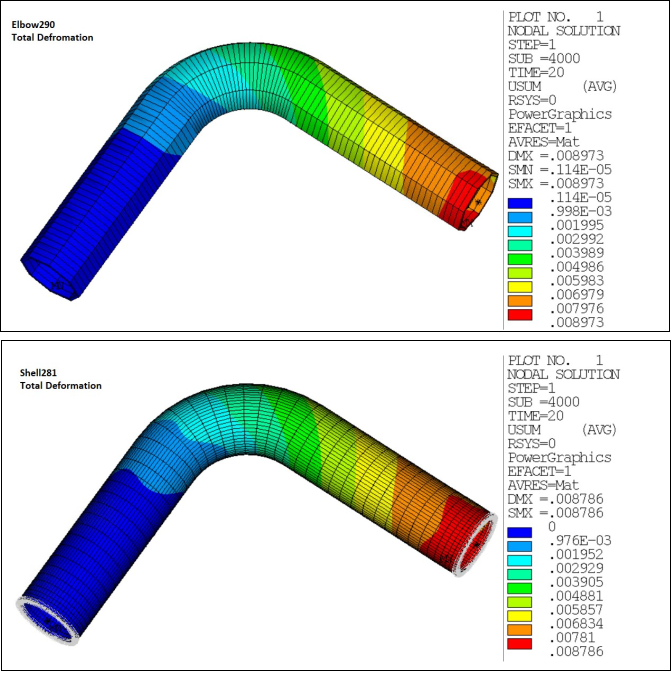
Figure 8.9: Ansys Workbench Mechanical - Native Total Deformation: Local ELBOW290 and SHELL281 Models
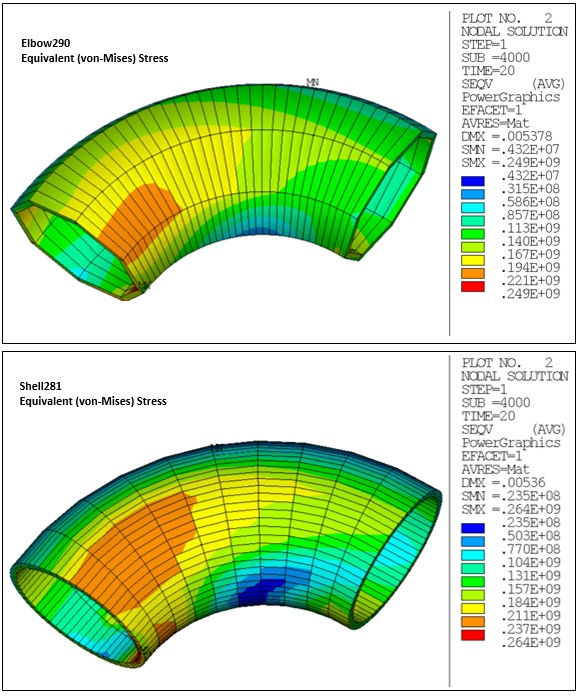
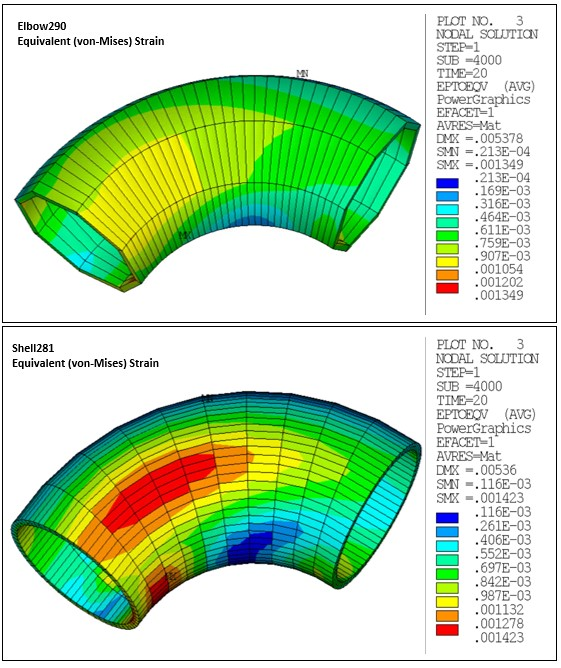
Von Mises stress and total mechanical strain for both models are shown in the following figures. Again, the close agreement between the stress and strain results from the two models is apparent.
The following table lists parameters that compare the computational efficiency of the of the local ELBOW290 and SHELL281 models used to simulate the elbow depicted in Figure 8.3: Elbow Model Line Diagram.
| ELBOW290 Local Elbow Model | SHELL281 Local Elbow Model | |
|---|---|---|
| Number of elements in the FEA model | 100 | 3024 |
| Solution time | 30 m 35 s | 3 h 36 m |
| Disk usage | 1.8 GB | 13.12 GB |
The solution time and disk space usage are approximately 86 percent less for the ELBOW290 model compared to the SHELL281 model.