


The plate material properties are shown in the table below.
| Steel Material Properties in (N-mm Units) |
|
Modulus of Elasticity = 1.8133E+5 MPa Poisson's Ratio = 0.3 |
| Uniaxial Plastic Strain Test Data for the Chaboche Kinematic Hardening material model are given in an excel file that you can download (See Workbench Input Files and Project Files). |
From the drop-down Units menu in Workbench, select and .
This section describes how to use the Chaboche model to obtain an accurate curve fit of uniaxial plastic strain test data in Workbench. The curve fit will then be used in the analysis of the plate with a notch with an applied varying pressure load to observe the ratcheting effect.
To transfer the uniaxial plastic strain test data from the excel file (chaboche-test-data.xlsx) into the Chaboche Kinematic Harding material model in Workbench, follow the steps described and illustrated in the figures below.
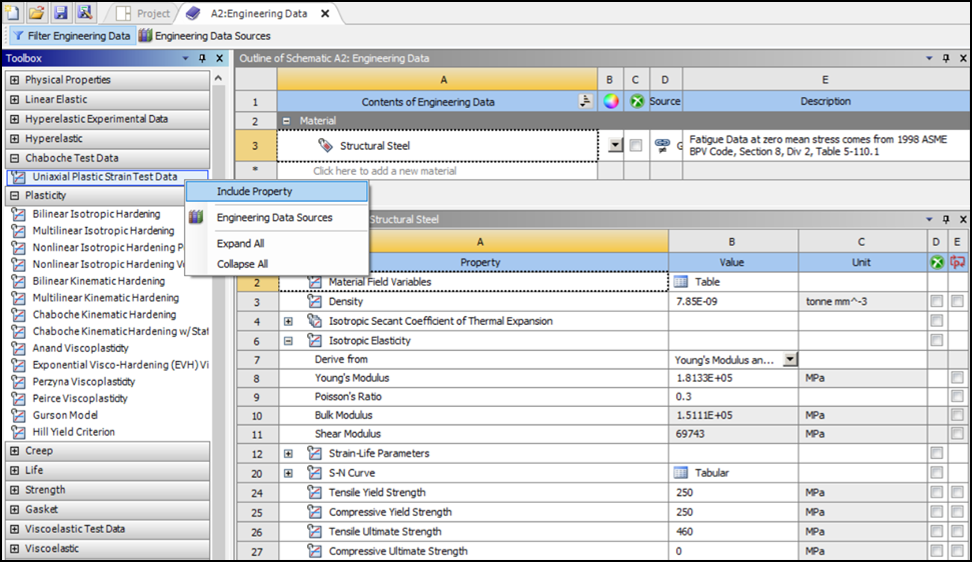
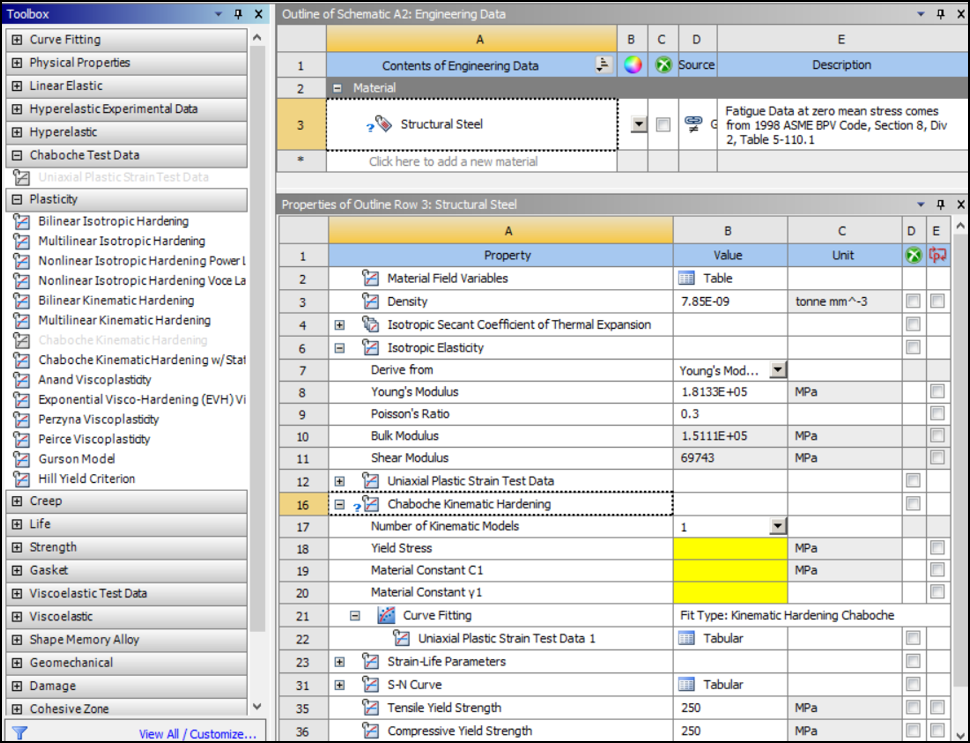
Double-click the Engineering Data cell to open the Engineering Data Workspace shown in the following figures. Select Structural Steel under materials. To include Uniaxial Plastic Strain Test Data in the Properties window of Structural Steel, right-click Uniaxial Plastic Strain Test Data under Chaboche Test Data in the toolbox and select Include Property from the drop-down menu options (see screenshot below).
Figure 31.6: Include Uniaxial Plastic Strain Test Data in the Properties Window of Structural Steel in Workbench
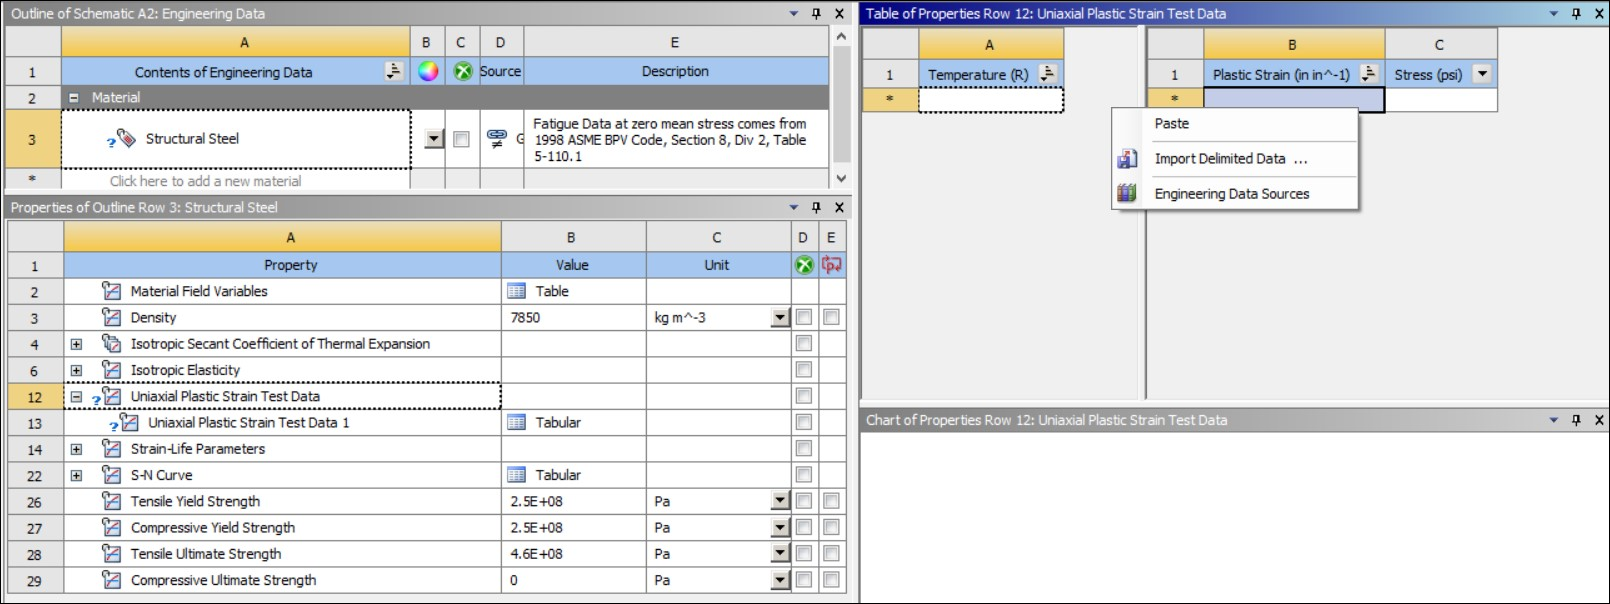
At this point, Uniaxial Plastic Strain Test Data is listed in the properties window, and you can add tabular data through its Table of Properties window as illustrated in the figure below. Copy the numerical data from the excel file (columns labeled "epply" and "sy", plastic stress and strain), and paste these data into the Table of Properties for Uniaxial Plastic Strain Test Data by right-clicking the empty cell beneath Plastic Strain and choosing Paste from the drop-down menu options.
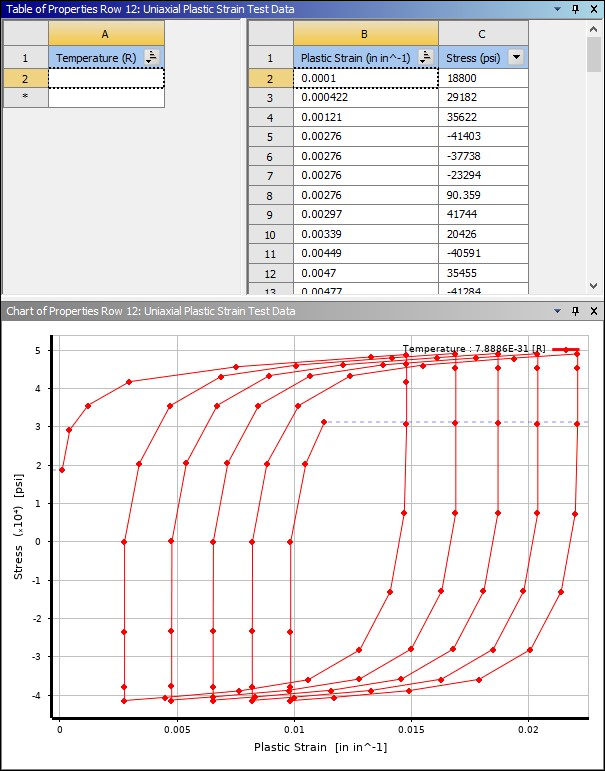
The Uniaxial Plastic Strain Test Data should now be listed in the Table, and the chart should look as shown below.
In this section, the Chaboche nonlinear kinematic hardening model will be used to determine material constants to accurately fit the input experimental data.
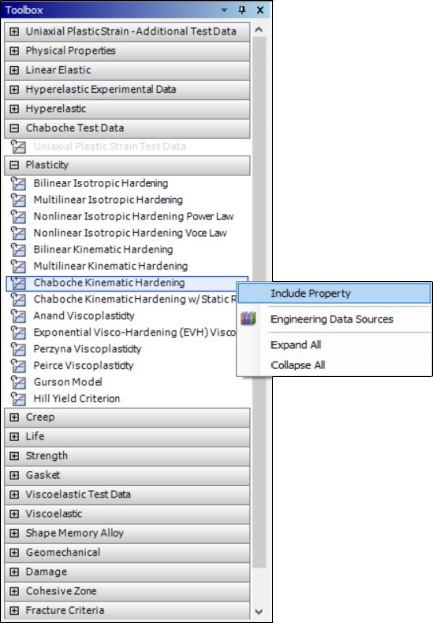
Expand Plasticity in the Toolbox, right-click the Chaboche Kinematic Hardening Property and select Include Property from the drop-down menu options as shown below.
This will include the Chaboche Kinematic Hardening property with defaults (Number of Kinematic Models = 1) as shown in the following figure.
Change the Number of Kinetic Models to 3 and solve by right-clicking Curve Fitting and selecting Solve Curve Fit from the drop-down menu options. The following figure shows the resulting curve fit.
Figure 31.11: Resulting Curve Fit for Chaboche Kinematic Hardening Model without Defining Initial Seed Values
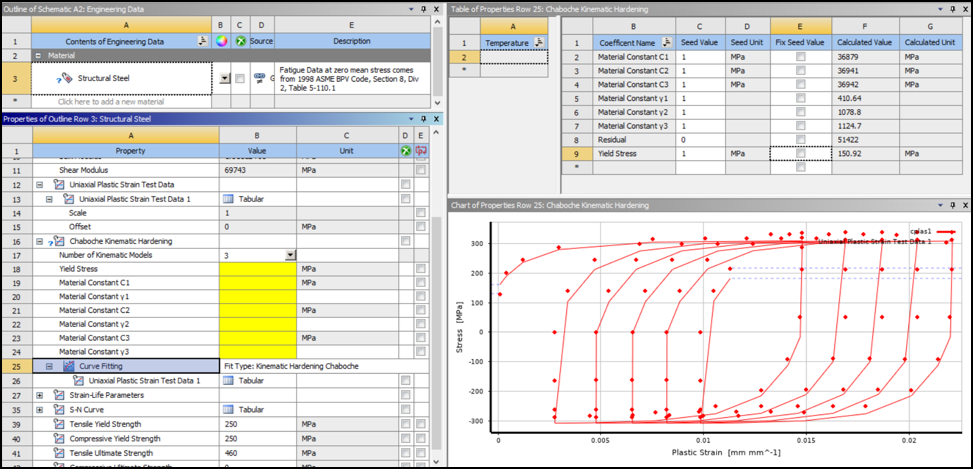
This resulting curve fit with three kinematic models is somewhat accurate as seen in the Chart in Figure 31.11: Resulting Curve Fit for Chaboche Kinematic Hardening Model without Defining Initial Seed Values. The accuracy can be improved by defining initial seed values as described below.
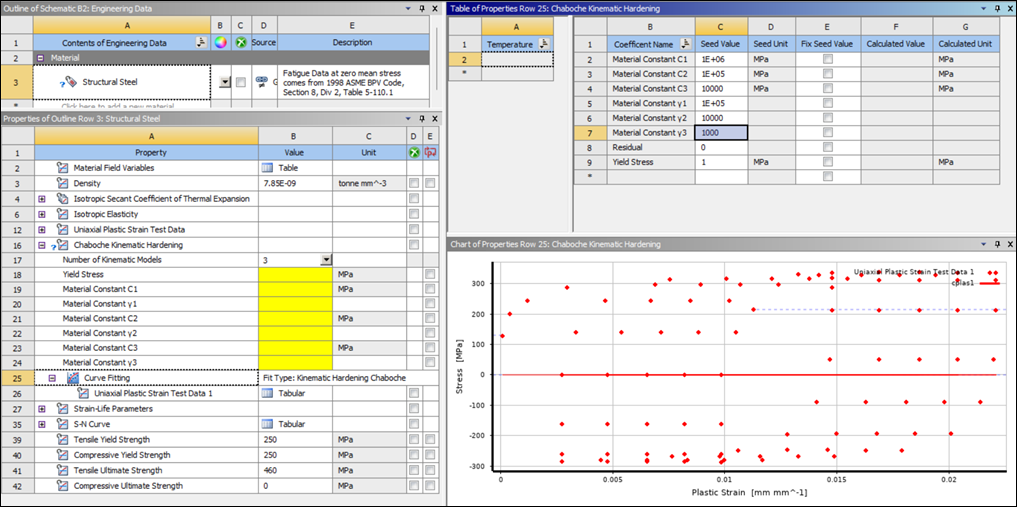
A study of the test data in Chaboche-Test-data.xlsx reveals an initial yield strength of 129.6 MPa and tangent moduli that vary between 1E+06 to 1000. To improve the curve fit accuracy, define initial values for the material constants as shown in the following figure. Specify Yield Stress = 1 MPa and γ3 = 1000.
Figure 31.12: Specify Initial Seed Values for Material Constants and Yield Stress to Improve Curve Fit Accuracy
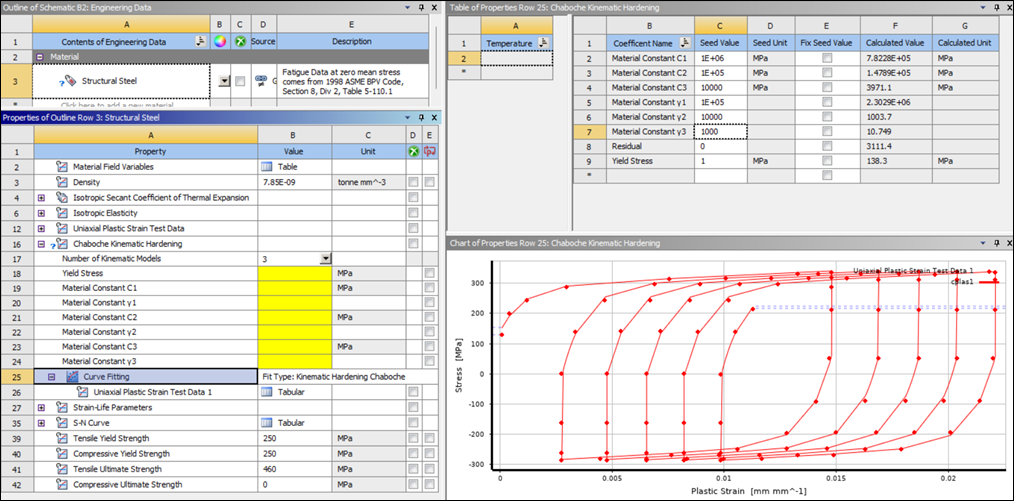
As before, recalculate the curve fit by right-clicking Curve Fitting and selecting Solve Curve Fit from the drop-down menu options. Solving the curve fit with the above seed values and constraints produces a curve fit with improved accuracy as seen in the following chart.
Once you have reviewed the accuracy of the coefficients, finalize the curve fitting process by including them in the analysis. To use the calculated values as material constants in your model, right-click Curve Fitting and select as shown below.
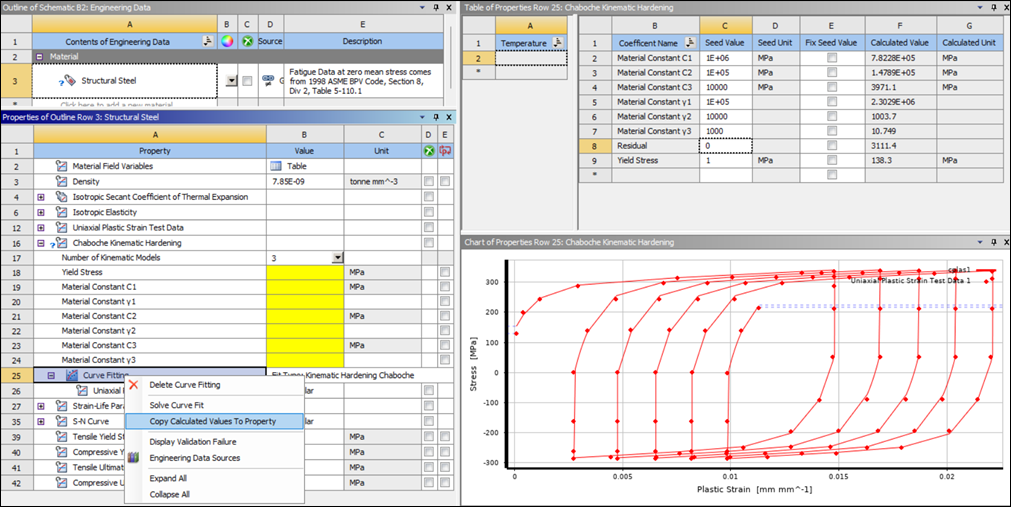
Observe that these calculated values have been effectively copied in the Properties for Structural Steel window as seen in the figure below.
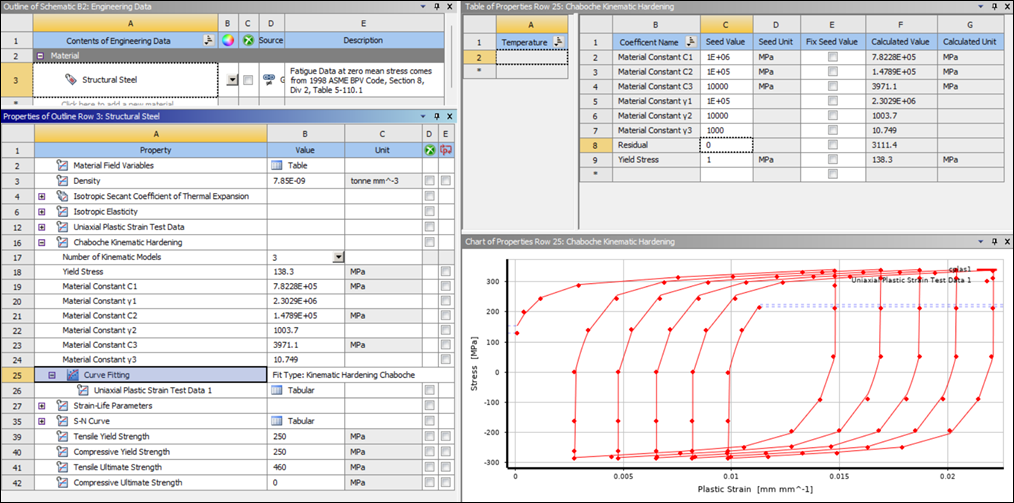
To use the calculated material constants in the analysis, click Refresh Project on the Project Tab in Workbench and double-click Model in the static structural analysis to start Mechanical.