VM-WB-MECH-108
VM-WB-MECH-108
Natural Frequency of a Piezoelectric Transducer
Overview
| Reference: | Boucher, D.,Lagier,M., & Maerfeld, C. (1981). Computation of the Vibration Modes for Piezoelectric Array Transducers Using a Mixed Finite Element Perturbation Method, IEEE Trans. Sonics and Ultrasonics. SU-28 (5) , 322, table 1. |
| Solver |
Ansys Mechanical |
| Analysis Type(s): | Mode-frequency Analysis |
| Element Type(s): |
3-D Coupled-Field Solid Elements 3-D 20-Node Coupled-Field Solid |
Test Case
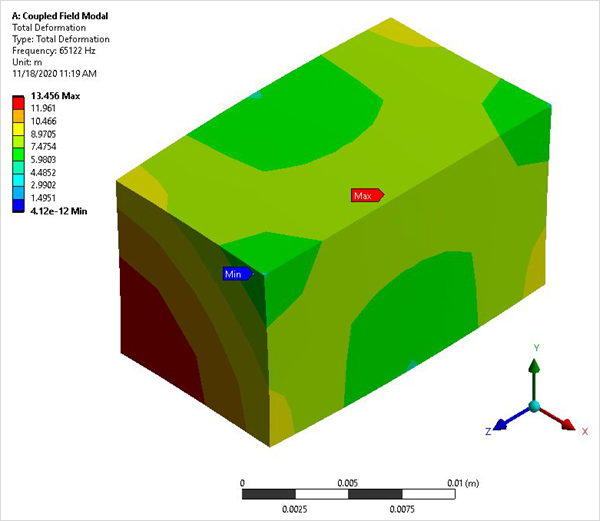
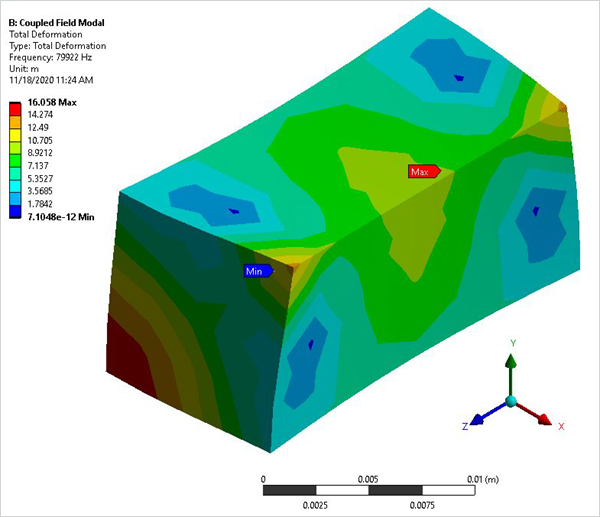
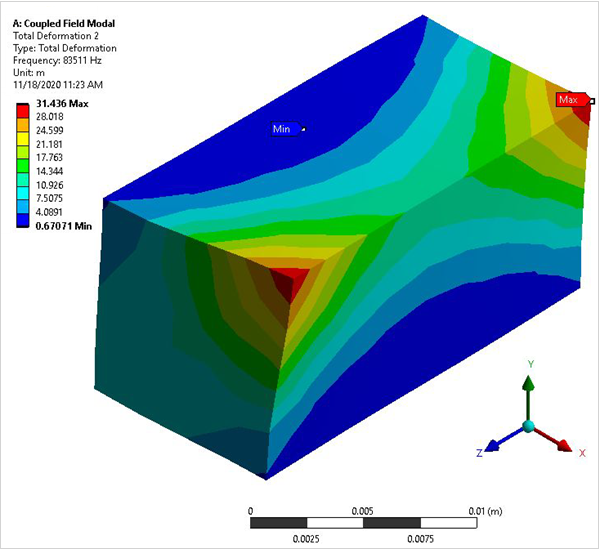
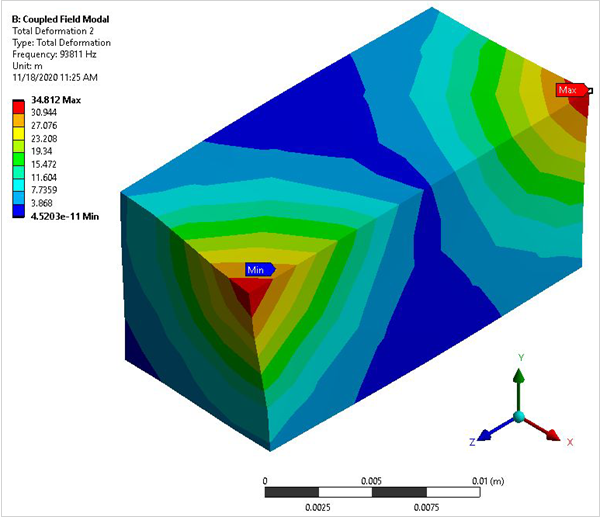
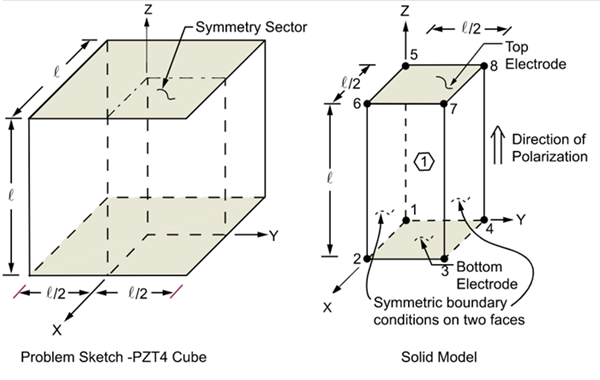
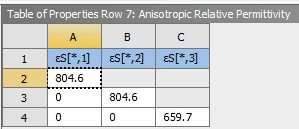
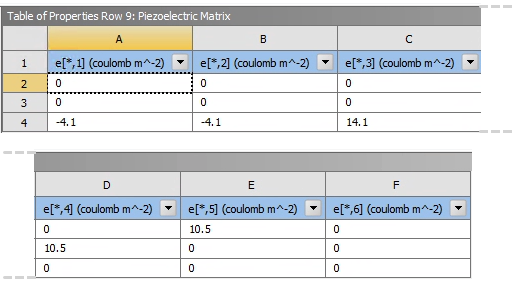
A piezoelectric transducer consists of a cube of PZT4 material with its polarization direction aligned along the Z axis. Electrodes are placed on the two surfaces orthogonal to the polarization axis. Determine the first two coupled-mode (breathing-type deformation) natural frequencies for the short circuit (resonance) case and the open circuit (anti-resonance) case.
This test case also appears in the Mechanical APDL Verification Manual. See VM175.
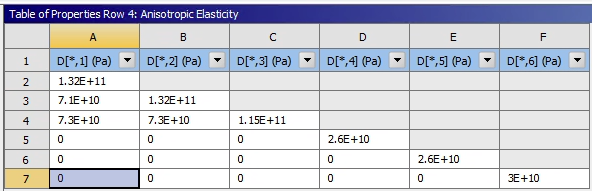
| Material Properties | Geometric Properties | |||
|---|---|---|---|---|
|
|

Analysis Assumptions and Modeling Notes
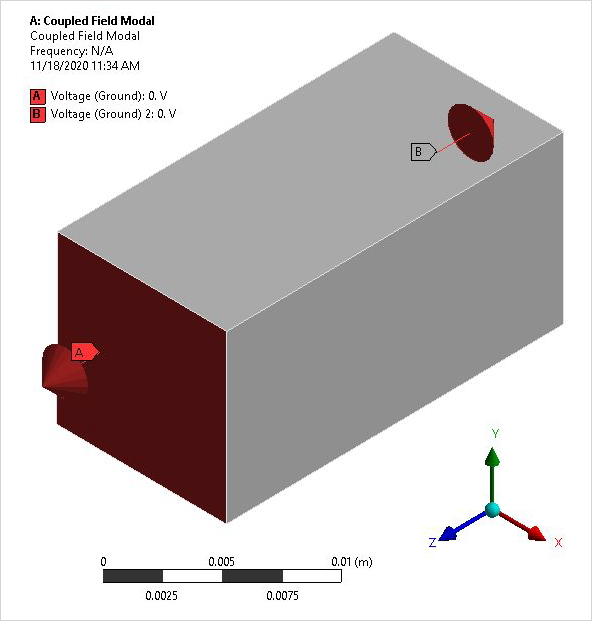
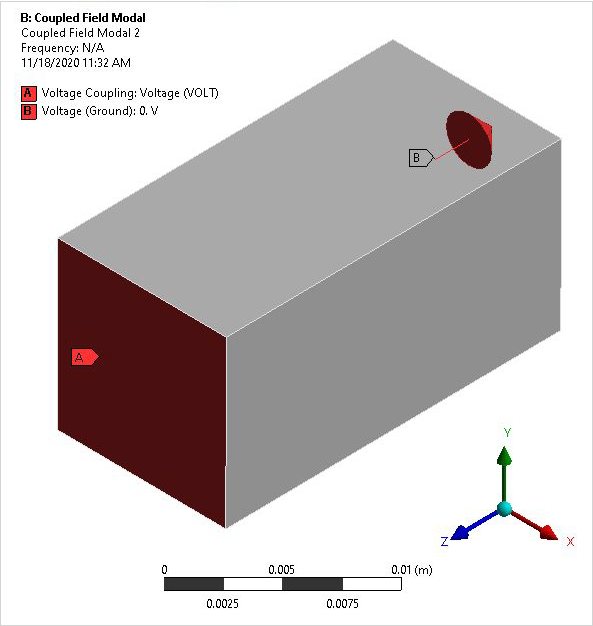
The electroded regions represent equipotential surfaces and are not modeled explicitly. For the short-circuit case, the top and bottom electrodes are grounded (voltages are set equal to zero). For the open-circuit case, only the bottom electrode is grounded. The short-circuit case represents excitation by potential while the open-circuit case represents excitation by charge.
A one-quarter symmetry sector is modeled with symmetry boundary conditions applied. The mesh density selected for analysis along the axes (X, Y, Z) are (2,2,4) elements respectively. All non-specified voltage degrees of freedom are condensed out during matrix reduction to allow for electro-elastic coupling.
The modes that produce a breathing-type deformation pattern indicate the desired results.