VM175
VM175
Natural Frequency of a Piezoelectric Transducer
Overview
| Reference: | D. Boucher, M. Lagier, C. Maerfeld, "Computation of the Vibration Modes for Piezoelectric Array Transducers Using a Mixed Finite Element Perturbation Method", IEEE Trans. Sonics and Ultrasonics, Vol. SU-28 No. 5, 1981, pg. 322, table 1. |
| Analysis Type(s): | Mode-frequency Analysis (ANTYPE = 2) |
| Element Type(s): | |
| Input Listing: | vm175.dat |
Test Case
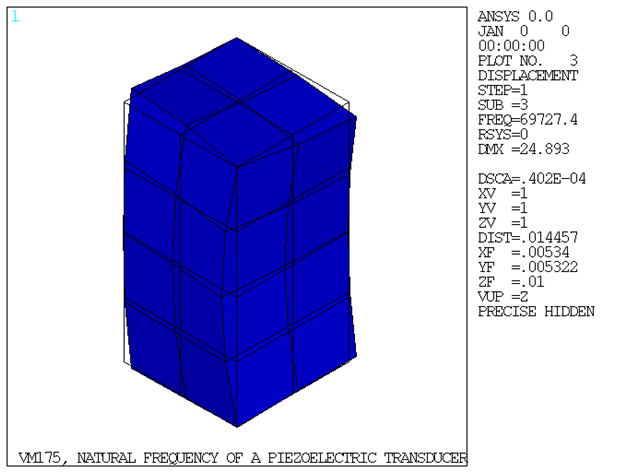
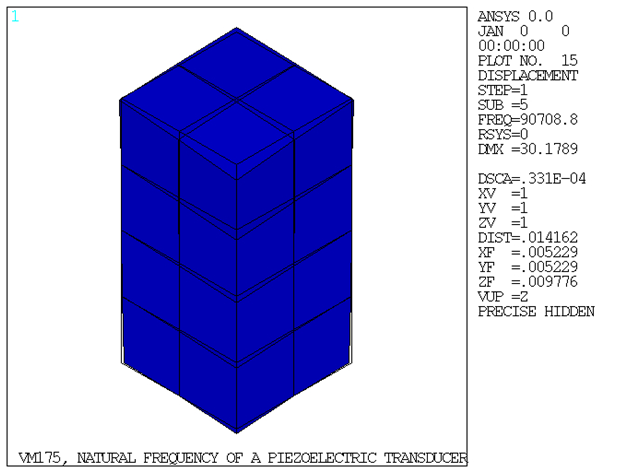
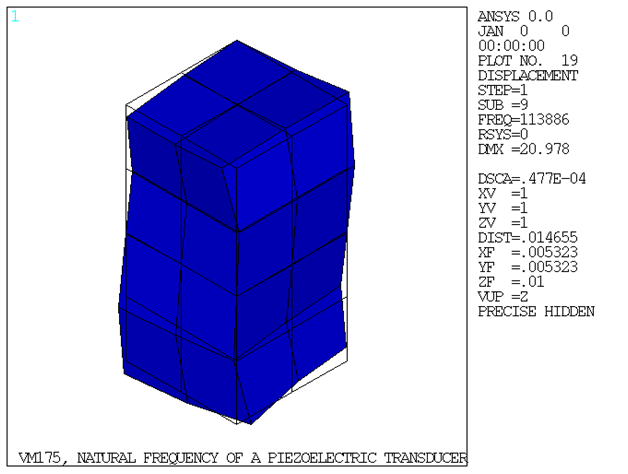
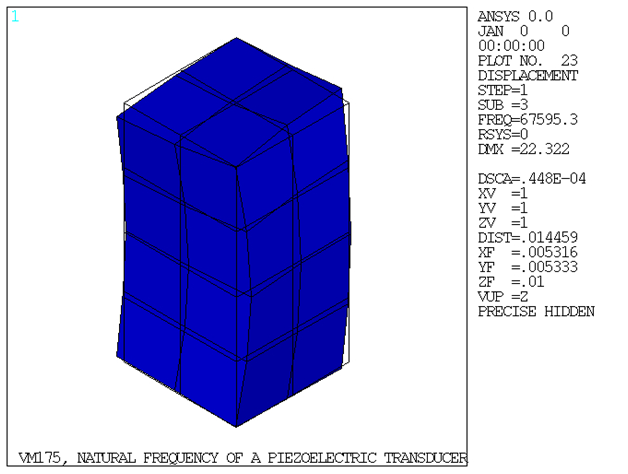
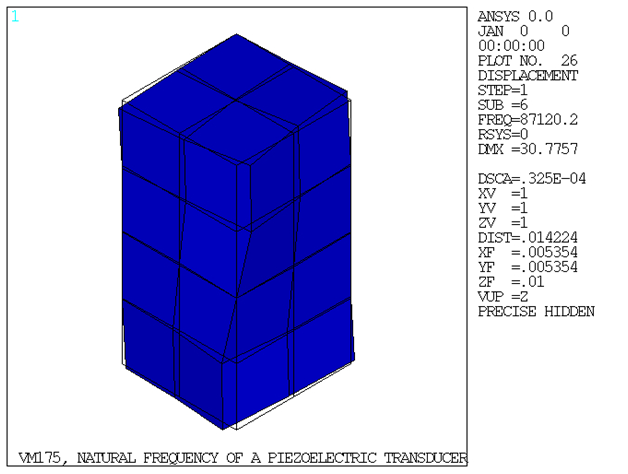
A piezoelectric transducer consists of a cube of PZT4 material with its polarization direction aligned along the Z axis. Electrodes are placed on the two surfaces orthogonal to the polarization axis. Determine the first two coupled-mode (breathing-type deformation) natural frequencies for the short circuit (resonance) case and the open circuit (anti-resonance) case.

| Material Properties | Geometric Properties | |||
|---|---|---|---|---|
|
|

Constitutive Matrices
PZT4 Dielectric Matrix [εr]

PZT4 Piezoelectric Matrix [e] C/m2

PZT4 "Stiffness" Matrix [c] x 1010 N/m2

Analysis Assumptions and Modeling Notes
The electroded regions represent equipotential surfaces and are not modeled explicitly. For the short-circuit case the top and bottom electrodes are grounded (voltages are set equal to zero). For the open-circuit case only the bottom electrode is grounded. The short-circuit case represents excitation by potential while the open-circuit case represents excitation by charge.
A one-quarter symmetry sector is modeled with symmetry boundary conditions applied. The mesh density selected for analysis along the axes (X, Y, Z) are (2,2,4) elements respectively. All non-specified voltage degrees of freedom are condensed out during matrix reduction to allow for electro-elastic coupling.
The KEYOPT(1) that is used does not have TEMP or MAG degrees of freedom.
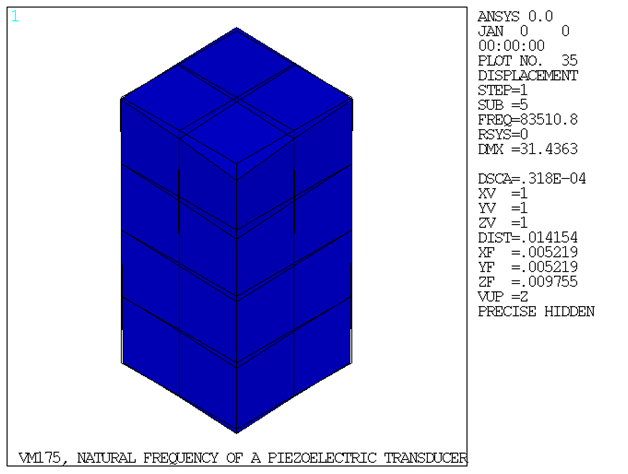
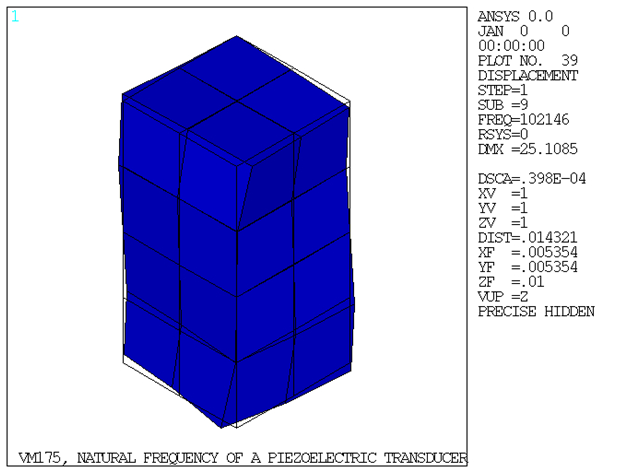
The modes that produce a breathing-type deformation pattern indicate the desired results. POST1 is used to display the mode shapes for determination of the desired natural frequencies.
Results Comparison
| Target[1] | Mechanical APDL | Ratio | ||
|---|---|---|---|---|
| SOLID5 | ||||
| Short Circuit | f1, kHz | 66560 | 66447 | 0.998 |
| f2, kHz | 88010 | 90709 | 1.031 | |
| Open Circuit | f1, kHz | 81590 | 84261 | 1.033 |
| f2, kHz | 93410 | 96988 | 1.038 | |
| SOLID226 | ||||
| Short Circuit | f1, kHz | 66560 | 65122 | 0.978 |
| f2, kHz | 88010 | 83511 | 0.949 | |
| Open Circuit | f1, kHz | 81590 | 79922 | 0.980 |
| f2, kHz | 93410 | 93811 | 1.004 | |