


Click the Unified icon ![]() to display a table in unified
view. This view slices table data into a 2D grid according to the value of the
variable you select.
to display a table in unified
view. This view slices table data into a 2D grid according to the value of the
variable you select.
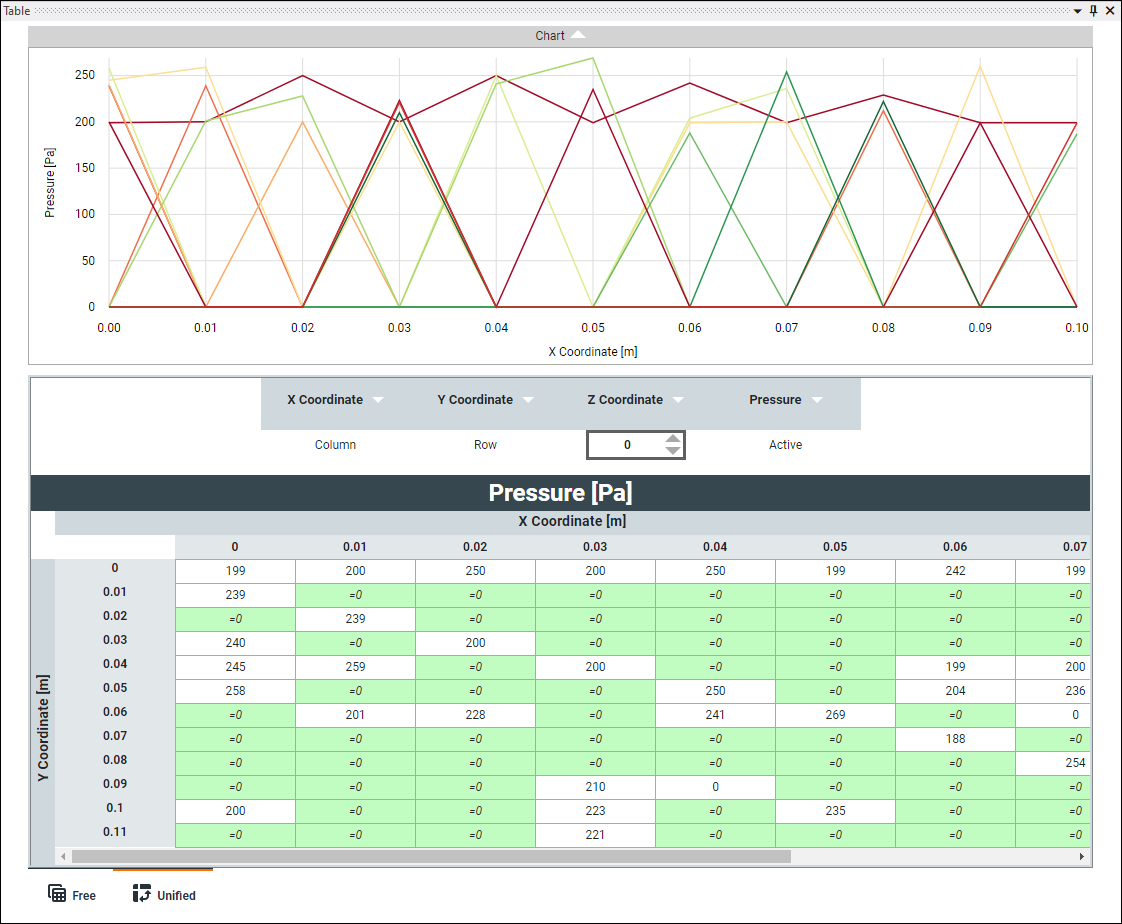
In unified view, you can step through slices (or cross-sections) of table data according to the value of the selected variable. Unified view displays a grid of the dependent variable versus other independent variables at each value of the selected variable.
Unified view shows where you may need to add dependent variable values to complete your table and fully model the load that it defines. The order of data in the table does not matter. Unified view shows all dependent variable values that are associated with the selected independent variable values, regardless of their row number or sort order.
For example, the example below plots and shows a table of Pressure values for the X Coordinate and Y Coordinate where the Z Coordinate is equal to zero (0). When you change the value of Z Coordinate, the table and plot show the corresponding pressure values for the X Coordinate and Y Coordinate.
Green cells that are labeled with =0 represent values that are not present in the table. The Mechanical APDL solver automatically sets these cells to zero when it computes a solution. See Enter and Edit Data in Unified View for more information.
The application remembers which view you last selected during this session and will load the table in that view the next time you open it.
You can perform the following operations on a table in unified view: