Click the down-arrow next to the name of a variable to change how it is plotted and displayed in unified view.
Choose to use the values of that variable as the columns in the unified table grid. The variable is also plotted on the x-axis of the graph in unified view. If the variable is already selected, is grayed out and a check mark is displayed next to it.
Choose to use the values of that variable as the rows in the unified table grid. If the variable is already selected, is grayed out and a check mark is displayed next to it.
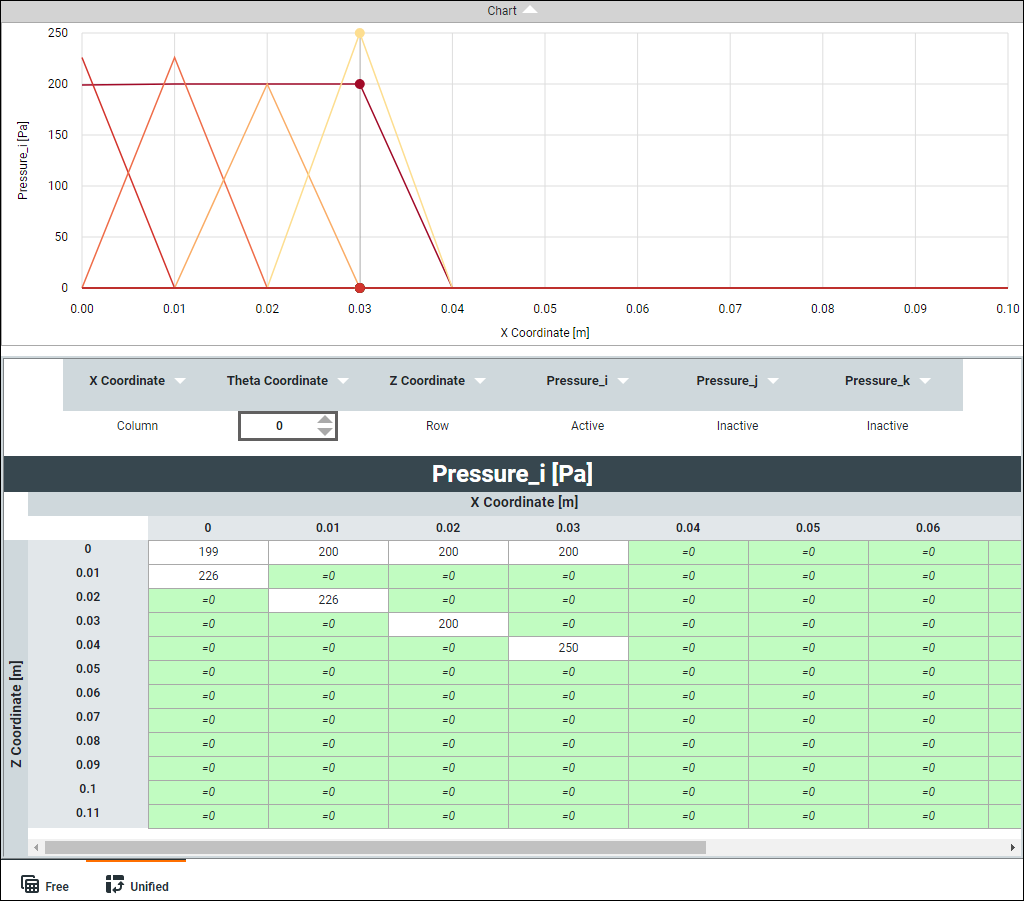
The values of the other independent variables specify which column and row values are plotted and displayed in the table. In the plot below, X Coordinate is selected as the Column variable and Z Coordinate is selected as the Row variable. The X Coordinate and Z Coordinate values of Pressure_i at a Theta Coordinate value of zero degrees are displayed in the table and plotted.
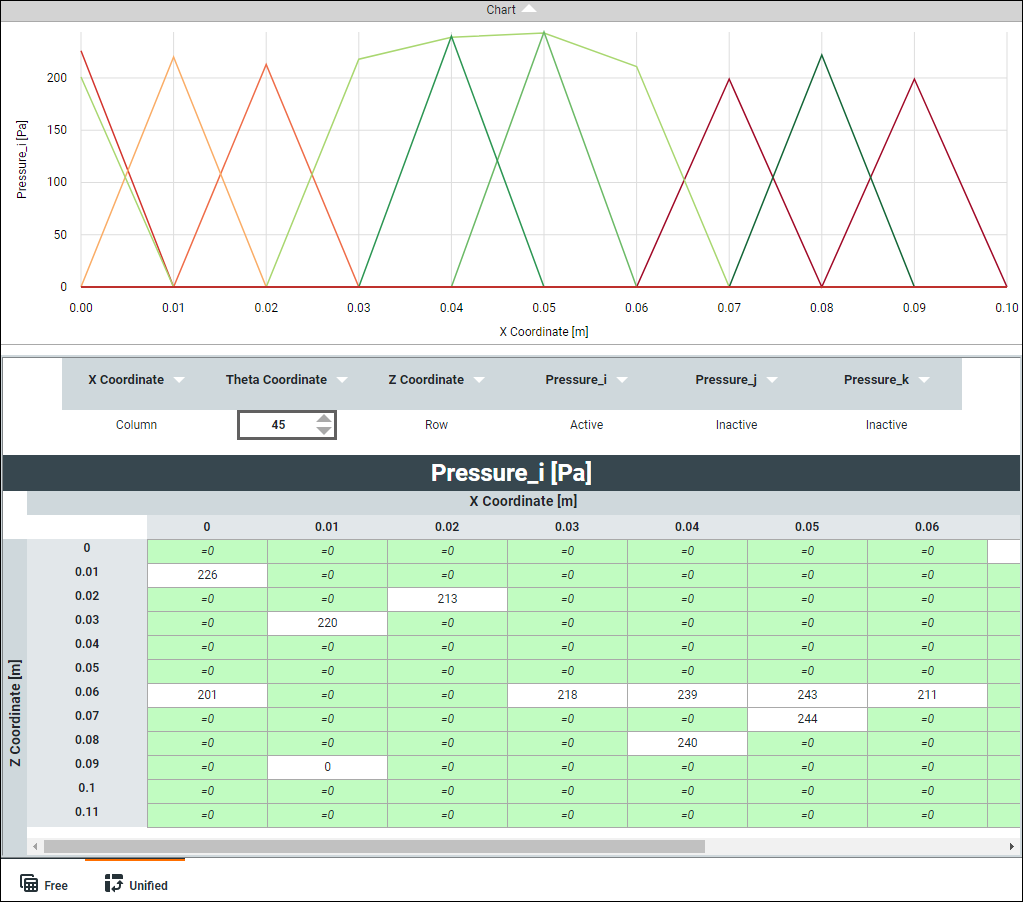
If you change the value of Theta Coordinate to 45 degrees, the corresponding X Coordinate and Z Coordinate values of Pressure_i are plotted.