A Campbell diagram chart result is only valid in Modal analyses. The Campbell diagram chart result is mainly used in rotor dynamics for rotating structural component design. When a structural component is rotating, an inertial force is introduced into the system. The dynamic characteristics of the structural component change as a result of the inertia effect, namely, gyroscopic effect. To study changes in dynamic characteristics of a rotating structure, more than one solve point in Rotational Velocity is required.
Prerequisites
In addition to being applicable to only Modal analyses, you must ensure that the following Analysis Settings are activated in order to properly apply a Campbell Diagram. Select the Analysis Settings object in your Modal Analysis and perform the following settings:
Under Solver Controls: Damped = .
Under Rotordynamics Controls:
=
=
In addition, a Rotational Velocity boundary condition must be created in order to properly scope the Campbell Diagram.
Applying a Campbell Diagram
To insert a Campbell diagram chart result, highlight the Solution object in the tree, then select Campbell Diagram from the Solution Context Tab, or right-click the object and choose >.
The following is an example of a Campbell diagram result chart:
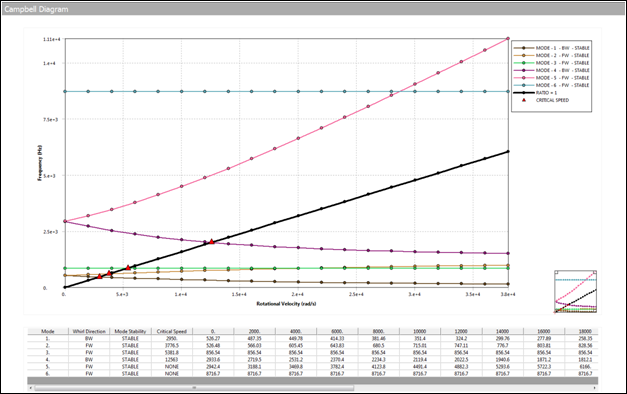
In this chart, each line represents a frequency evolution of a whirl mode with respect to increased rotational velocities. The whirl frequency value of an eigenmode at each rotational velocity is also listed in the table. For each whirl mode, it is either labeled as forward (FW) or backward (BW) whirl direction. In some cases, when there is no evident whirl direction, the whirl frequency is labeled as UNDETERMINED. If a whirl mode is identified as FW, the rotating structural component whirls the same direction as the rotation direction, and vice versa. If a whirl mode is evaluated to be unstable (marked as UNSTABLE), the whirl orbit will evolve into a divergent trajectory, instead of an elliptical trajectory.
In addition to whirl modes, a line (black color) of any ratio between whirl frequency and rotational velocity is plotted. The intersection between this line and each whirl mode is indicated with a red triangular marker. The rotational velocity corresponding to this intersection is called critical speed. At critical speed, the rotating structural component will experience a peak as the rotating frequency resonates with the natural whirl frequency.
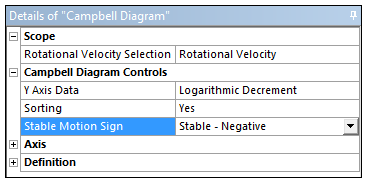
The Campbell diagram chart result can be customized in Details of Campbell Diagram as follows:
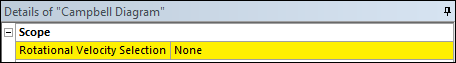
Scope
Rotational Velocity Selection: This field displays the user-defined Rotational Velocity of the analysis for which the Campbell diagram chart result is evaluated. If one is not defined, the field is highlighted in yellow and displays the value .
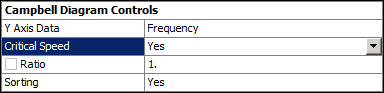
Campbell Diagram Controls
Y Axis Data: The data type options include: (default), , , and .
Critical Speed: Option for users to display critical speeds. The default is . Requires you to provide a value in the Ratio field. The option is only valid for frequency.
Ratio: Value used to evaluate critical speeds. The default value is.
Sorting: Option to display data in a sorted mode manner when some modes are crossing/intercepting each other. The default is .
Stable Motion Sign: This option displays when you specify for the Y Axis Data property. This option controls the sign of Logarithmic Decrement value for stable motion. The options include (default) and .
Note: Any change made in these fields requires a result re-evaluation.
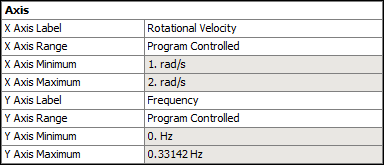
Axis
Note: Two different unit types, rad/s and RPM, are available to define rotational velocity in the chart. The selection can be made in Units option on the Home tab.
X Axis Label: Allows users to provide a customized label for rotational velocity.
X Axis Range: There are two options to display the rotational velocity data range: and . The default setting is , which uses minimum and maximum determined by the system. The option of allows users to provide a customized range to be used in the chart. The minimum and maximum values are displayed in the X Axis Minimum and X Axis Maximum fields following the result evaluation.
X Axis Minimum: Minimum rotational velocity value is displayed according to the selection made in X Axis Range.
X Axis Maximum: Maximum rotational velocity value is displayed according to the selection made in X Axis Range.
Y Axis Label: Allows users to provide a customized label for , , , or depending on the selection made in Y Axis Data.
Y Axis Range: The options include and , to display the frequency, stability, logarithmic, or modal damping ratio value range depending on the selection made in Y Axis Data property. The default setting, , uses the minimum and maximum determined by the system. The option of enables you to provide a customized range. The minimum and maximum values are displayed in the Y Axis Minimum and Y Axis Maximum fields following the result evaluation.
Y Axis Minimum: Minimum frequency, stability, logarithmic decrement, or modal damping ratio value is displayed according to the selection made in Y Axis Range property.
Y Axis Maximum: Maximum frequency, stability, logarithmic decrement, or modal damping ratio value is displayed according to the selection made in Y Axis Range property.