


For the Mode Contribution result, you can filter result data in the Graph and Tabular Data windows and present the data in a mosaic chart highlighting the modal coefficient for each mode shape for each analysis frequency. Using the display options of the result, you can filter the visibility for the top contributing mode shapes and analysis frequency range.
Viewing the Mode Contribution
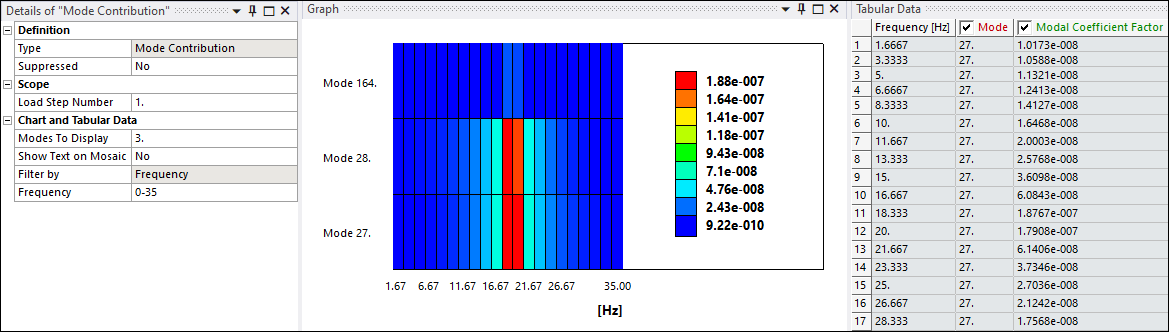
The application plots modal coefficient values in the Graph and Tabular Data windows per mode shape (Y Axis) versus the analysis frequency range specified in the Step Controls of the Analysis Settings object of the analysis.
Details pane properties related to the contribution, under the Chart and Tabular Display category, include:
Load Step Number: You first select a load step to use to filter data. Load steps are specified using the Number of Steps property in the Step Controls of the Analysis Settings object. Zero (0) is not a supported entry.
Display Mode: Use this property to filter graph and tabular data by mode for given frequency values. Options include and (default). When set to , the application displays result data plotted in a bar chart. When set to , the application displays result data by Mode value plotted in a mosaic chart.
Show Text on Mosaic: Display the result values of each frequency for the panels. Options include (default) and .
Mode to Display: This is an entry property to further filter graph and tabular data using a single mode value, multiple mode values, or a range of mode values. The number of available modes is determined by the setting of the Max Modes to Find property in the Analysis Settings. For property entries, you can enter multiple values, separated by a comma (12, 16, 24) as well as range values separated by a hyphen (28-40), or a combination of entries, such as 12, 16, 24, 28-40.
Frequency: This is an entry property to further filter graph and tabular data by frequency value.